Figure 4 of
Wang, Mol Vis 2010; 16:2777-2790.
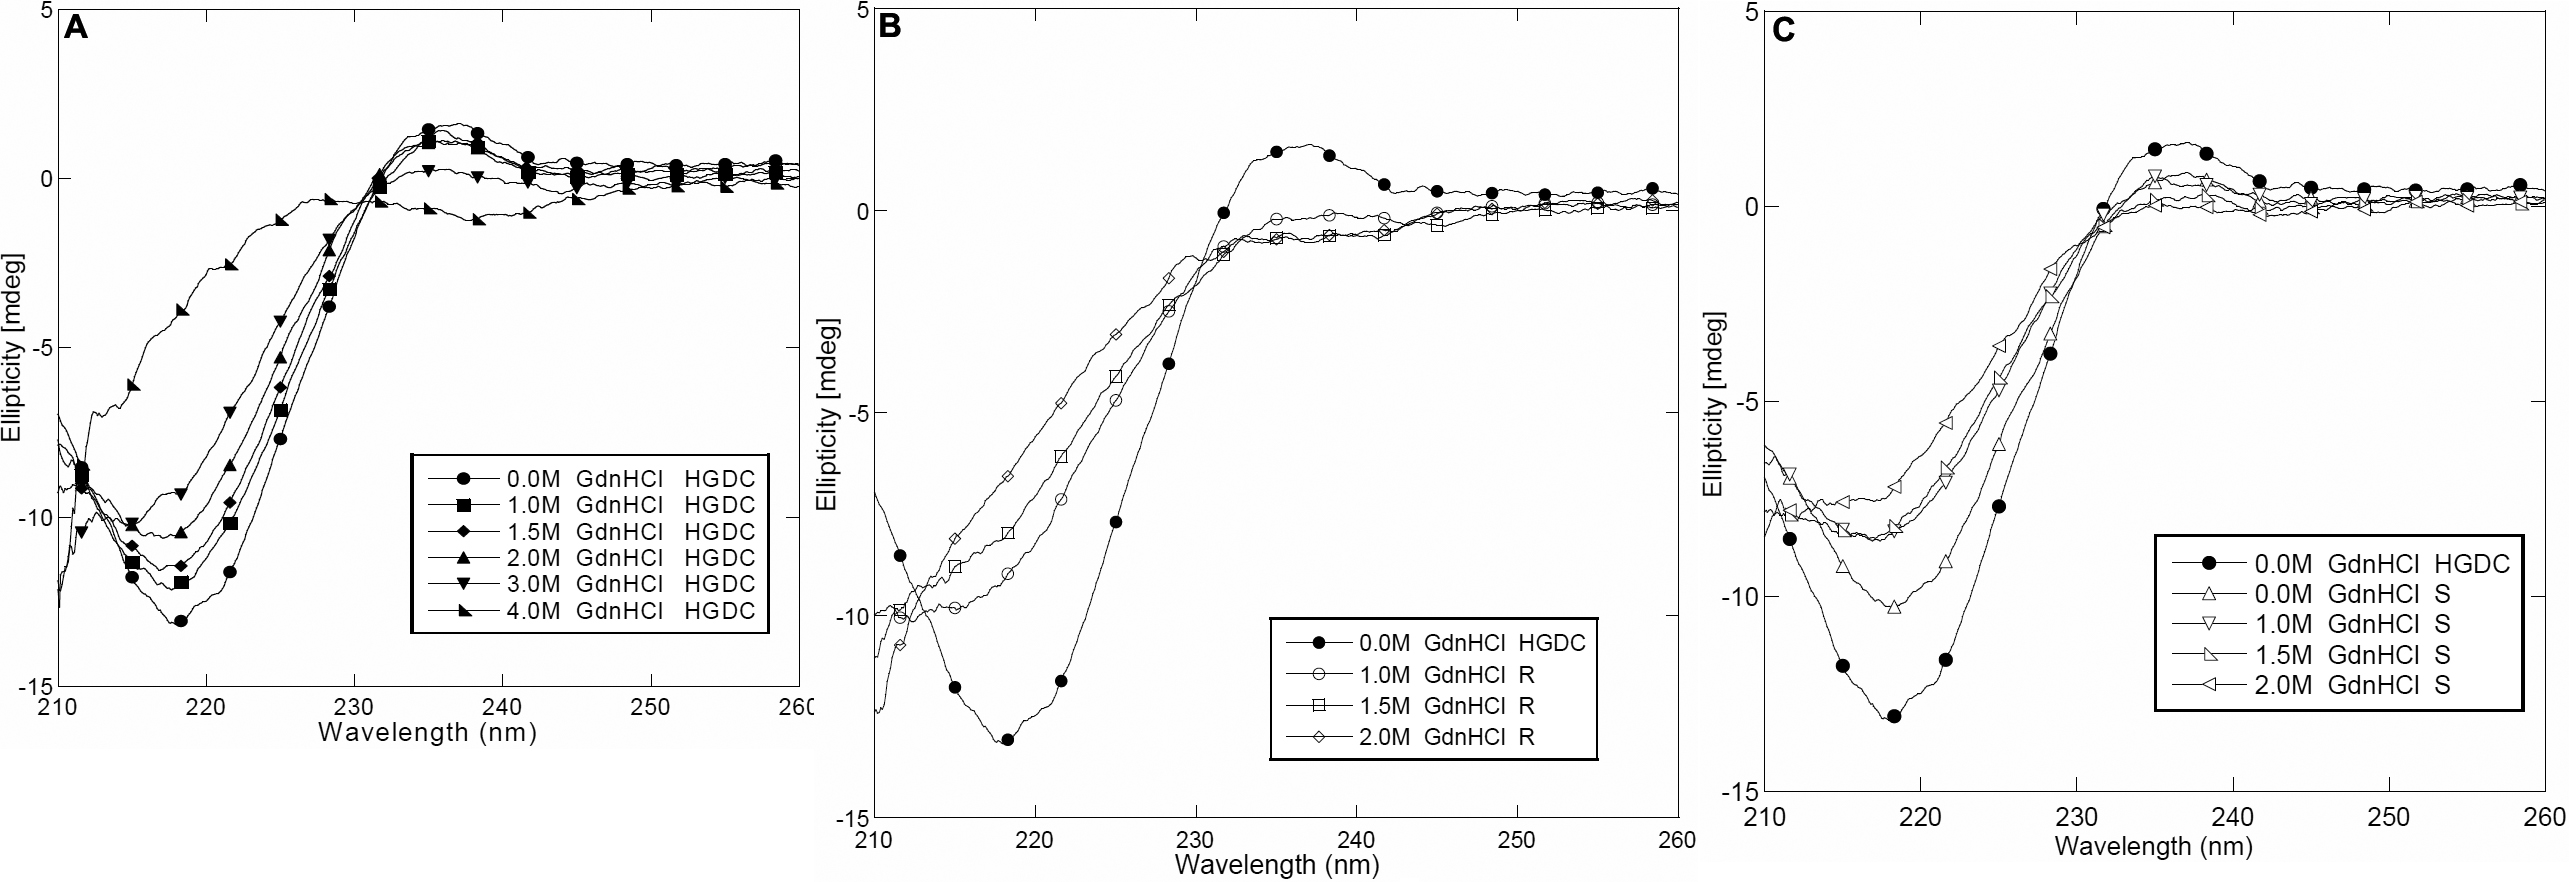
Figure 4.
Representative far-UV CD spectra of HGDC samples with various concentrations of GdnHCl.
A
: Non-irradiated HGDC,
B
: Re-dissolved precipitated fraction of UV-C irradiated HGDC (R), and C: Supernatant fraction of UV-C irradiated HGDC (S).
 Figure 4 of Wang, Mol Vis 2010; 16:2777-2790.