Figure 2. Quantitative comparison of regional ADAM/ADAMTS gene expression. A: ADAM and B: ADAMTS gene expression in each of the three regions of the native human lens; anterior epithelia, equatorial region epithelia and
fibers. The x-axis represents the gene of interest/18S expression calculated as mean±SEM. In individual native lens regions
significance at p≤0.05 (*) was determined (ANOVA with Tukey's post-hoc analysis) in that region versus the other two regions
of each lens.
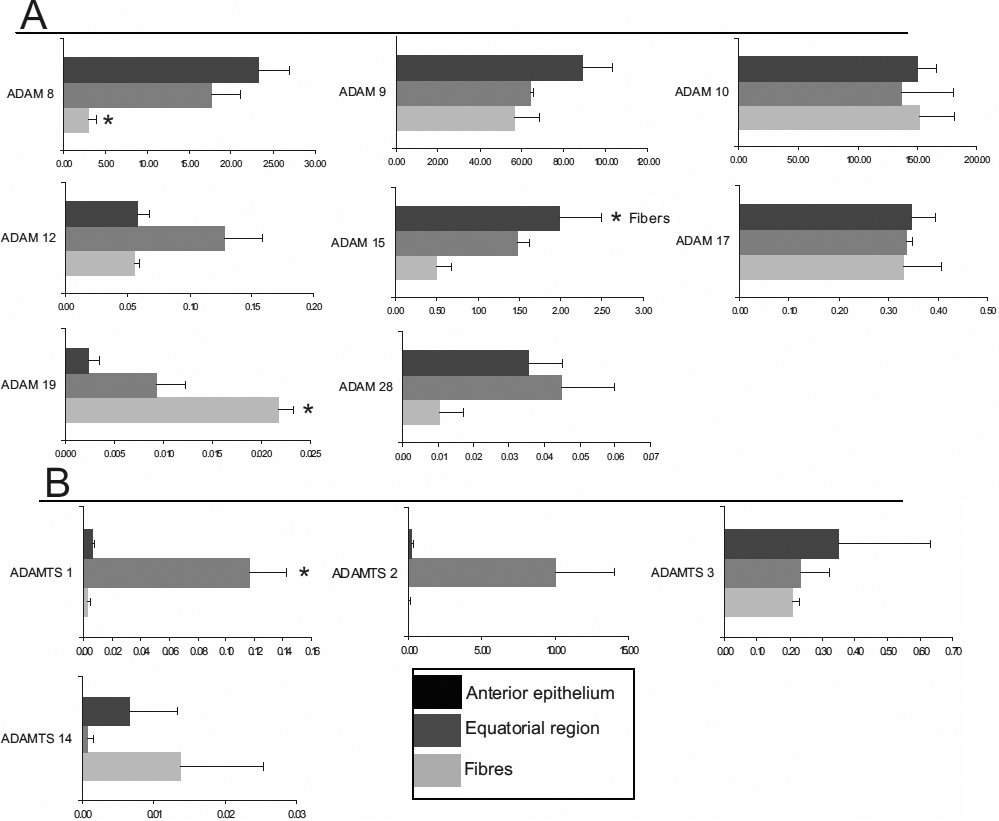
 Figure 2 of
Hodgkinson, Mol Vis 2010; 16:2765-2776.
Figure 2 of
Hodgkinson, Mol Vis 2010; 16:2765-2776.