Figure 1. ADAM/ADAMTS gene expression profiles were classified in lens regions (donors 1–3). The cycle threshold number (CT) was used to classify gene expression as either very high (CT≤20), high (CT=21–25), moderate (CT=26–30), low (CT=31–38) or negligible to undetected (CT=39–40). Donor information; number: (1–3), sex (F; female, M; male), age and ophthalmic history; 1: F, 74, none; 2: M, 84,
none; 3: M, 81, none.
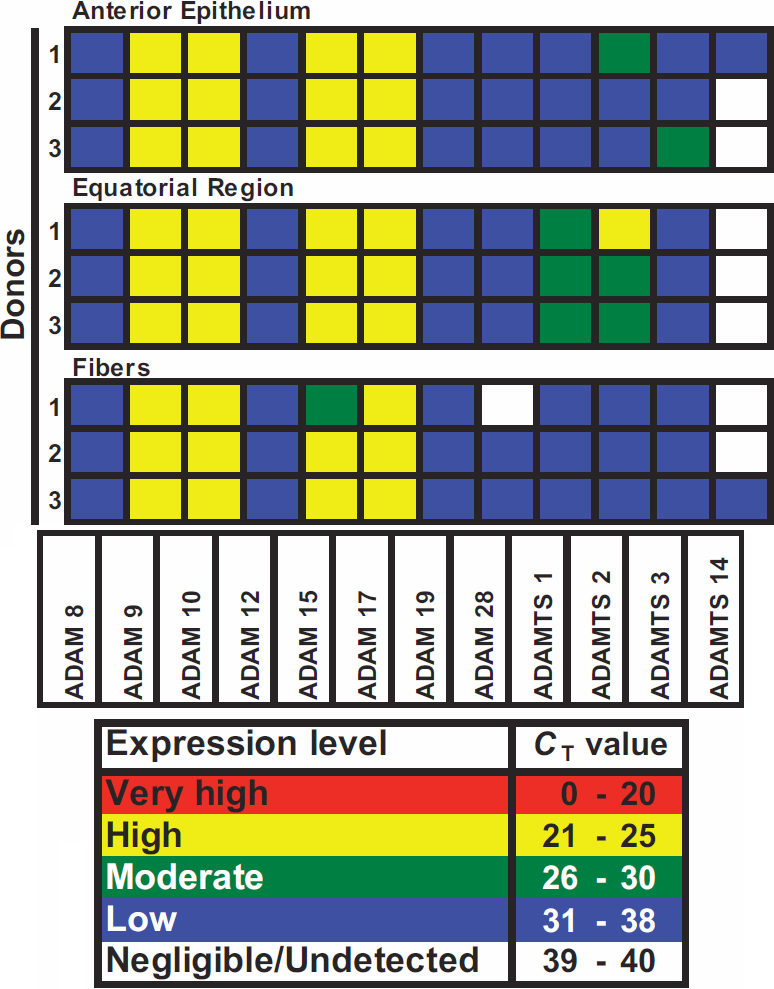
 Figure 1 of
Hodgkinson, Mol Vis 2010; 16:2765-2776.
Figure 1 of
Hodgkinson, Mol Vis 2010; 16:2765-2776.