Figure 1. Pedigree structure and segregation analysis of mutations in families. A: Family RP50; M represents c.8299G>T. B: Family W09–0046; M represents c.9082G>T. Genotypes are indicated below the genetic symbols. Asterisks indicate the individuals
that were analyzed on single nucleotide polymorphism arrays.
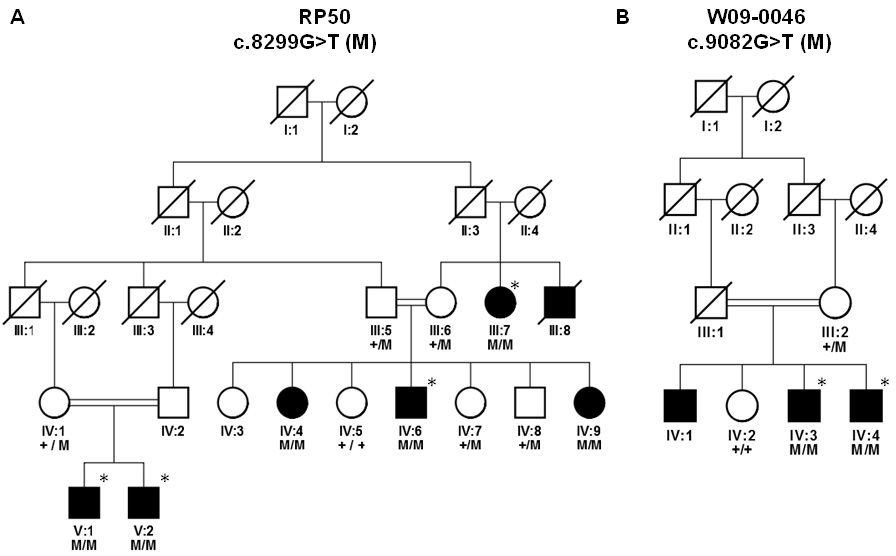
 Figure 1 of
Khan, Mol Vis 2010; 16:2753-2759.
Figure 1 of
Khan, Mol Vis 2010; 16:2753-2759.