Figure 3. Lens crystallins expression responded to stimuli like H2O2 and LPS. A: Relative intensity of each gene to RPL5 detected by QRT–PCR in untreated cells (control) was arbitrarily set as 1.0. Shown
was one representative of three similar experiments. B: In western blot assay, ratio of αA-crystallin intensity to that of GAPDH in control cells was arbitrarily set as 1. Numbers
above the αA-crystallin bands (mean±standard error) were obtained from three independent experiments. respectively.
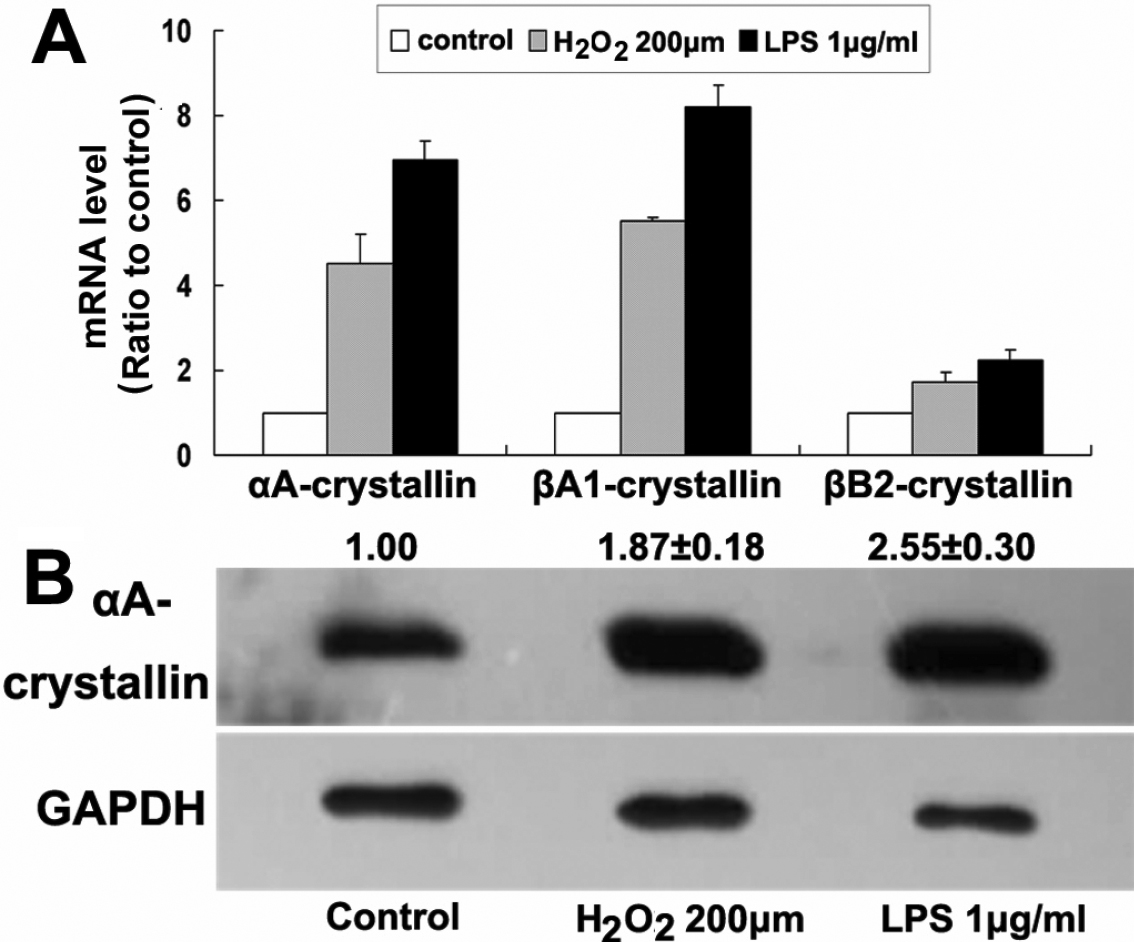
 Figure 3 of
Ren, Mol Vis 2010; 16:2745-2752.
Figure 3 of
Ren, Mol Vis 2010; 16:2745-2752.