Figure 1. Expression of lens crystallins
in murine corneas. C57BL/6, open; Balb/c mice, filled, both 6–8 weeks
old. The relative intensities of genes versus RPL5 were obtained by
comparison of amplification dynamic Ct for each gene in QRT–PCR assay.
Each sample was run in triplicate wells in PCR reaction, and the error
bars represented standard errors for three samples in each group.
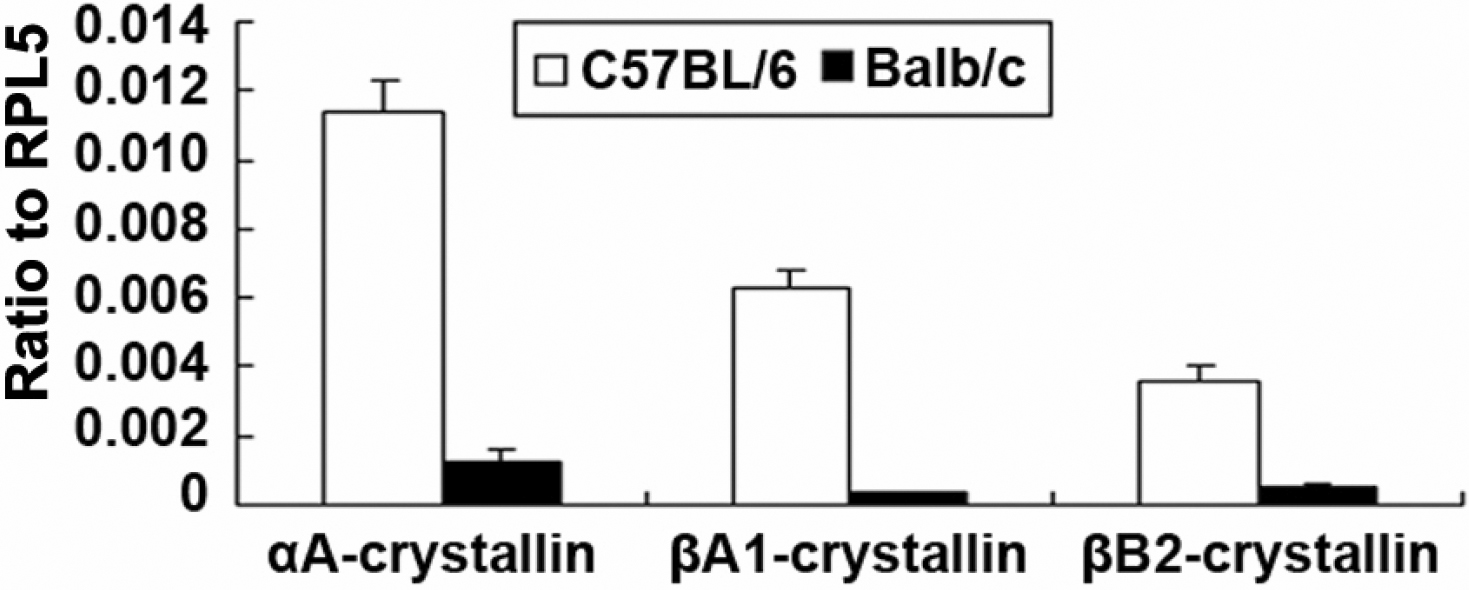
 Figure 1 of Ren, Mol Vis 2010; 16:2745-2752.