Figure 2. Wnt2b is not expressed at optic cup lip if anterior pigment epithelium (PE) is mis-specified. A: A Graphic of the introduction of replication-incompetent retrovirus into the presumptive retinal pigment epithelium (RPE)
at optic vesicle stages. B: An embryo at Hamburger-Hamilton (HH) stage 25, 4 days after injection. White patches are seen on the infected eye. C: The eye of embryo in B, stained with X-gal (blue stain) to visualize infected cells within the depigmented patch (green arrows). D: X-gal stained eye, showing that a white depigmented zone consistently extends beyond immediately vicinity of infected cells
(green brackets). E, F: Section analysis through additional white patches, showing outer RPE (brown pigmentation, white arrows), a depigmented portion
contiguous with the RPE (black arrows) and the inner layer of the optic cup (as labeled). Infected cells (blue cells, black
arrowheads) are found in the RPE layer. At a distance of approximately 100 microns from infected cells the depigmented tissue
transitions back into RPE tissue. G-L: Infected eyes at HH stage 25 with depigmented patches that fall in the anterior optic cup lip (arrows). G, H: An eye with a small patch of depigmentation at the extreme edge of the optic cup (arrow). I: The same eye as in H after in situ hybridization to localize Wnt2b expression showing no expression in the depigmented optic cup lip (arrow).
All parts of the unaffected optic cup lip express Wnt2b in a lip specific pattern (white asterisks). At the transition zones
occurring at the edges of the depigmented patch, Wnt2b is ectopically expressed (green asterisks). J, K: An eye with a larger patch of mis-specified anterior optic cup lip (arrow). L: The eye of embryo in K showing Wnt2b gene expression. No expression is found in mis-specified lip (arrow). Unaffected regions of the eye express
Wnt2b at the lip (white asterisks). Aberrant Wnt2b expression is found at the transition zone between pigmented and depigmented
tissue. Scale bars in D-F are equal to 200 µm, in E and G are equal to 500 µm and in H and K are equal to 250 µm.
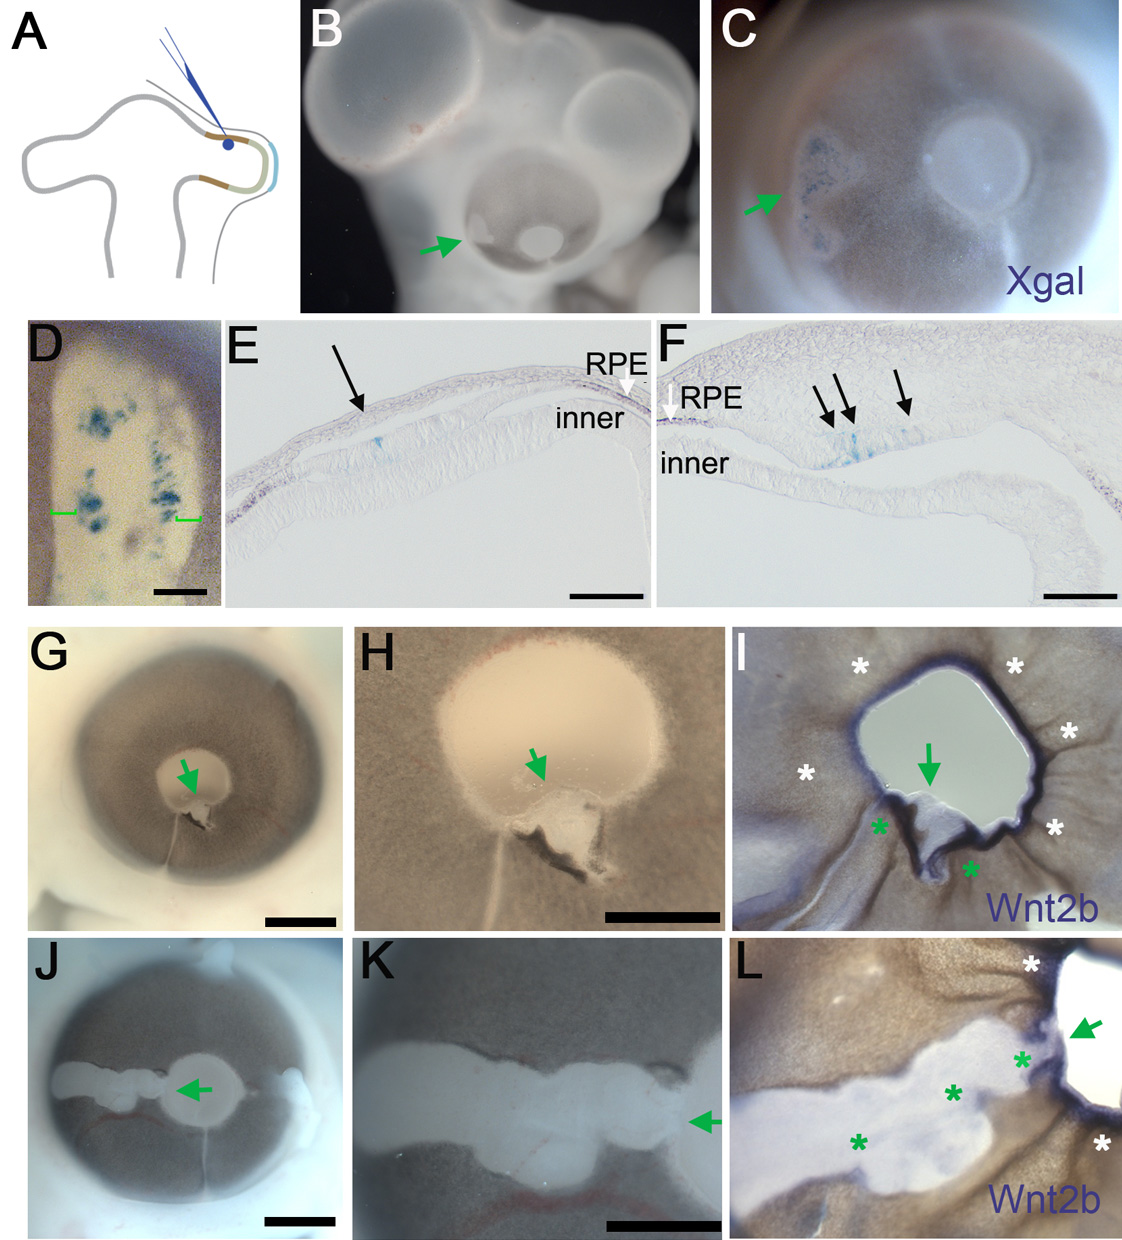
 Figure 2 of
Kitamoto, Mol Vis 2010; 16:2701-2717.
Figure 2 of
Kitamoto, Mol Vis 2010; 16:2701-2717.