Figure 3. Levels of glutathione in the lenses of different groups. The values are expressed as Means±standard deviation. The depression
of GSH in the galactose alone group as compared to the normal as well as when compared to the galactose plus caffeine group
is highly significant (p values ≤0.001) at all points of observation. The values in the galactose plus caffeine group were
also significantly higher than the galactose alone group. By 25 day the GSH value in the galactose plus caffeine group was
lower than in the control groups, but was still higher than in the galactose alone group and adequate to maintain lens transparency
barring the periphery.
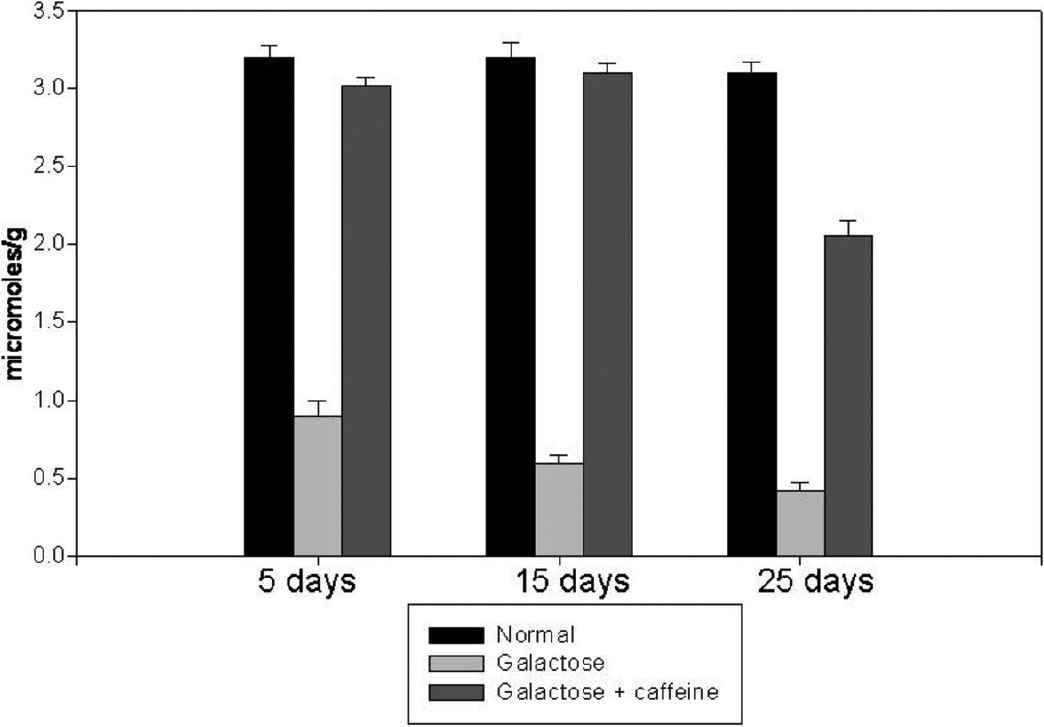
 Figure 3 of
Varma, Mol Vis 2010; 16:2626-2633.
Figure 3 of
Varma, Mol Vis 2010; 16:2626-2633.