Figure 4. Retinal degeneration in
3-week-old rd10 mouse was compared to 3-week-old rd10/wild type (WT)
and rd10/human transferrin (hTf) mice. A-C: Central part
of equatorial sections represent histology from 3-week-old rd10 (A),
rd10/WT
(B), and rd10/hTf (C) mouse retinas. Nuclei were
stained with toluidin blue. D-E: Outer nuclear layer
(ONL; D) and inner nuclear layer (INL; E) thickness
were measured every 200 μm, along the entirety of retinal sections of
rd10, rd10/WT, and rd10/hTf mice at 3 weeks postnatally. (black line)
rd10 mice, (red line) rd10/hTf mice, (gray line) rd10/WT mice. Values
represent means±SEM, n=6–8. rd10/hTf mice were compared to rd10 mice: *
p<0.05; **p<0.001; ***p<0.0001; ns represents not significant.
rd10/hTf mice were compared to rd10/WT mice (≠≠ p<0.001; ≠≠≠
p<0.0001; ns: not significant; ON is optic nerve). F-M:
Terminal
deoxynucleotidyl transferase dUTP nick end labeling (TUNEL)
was used to stain retinas from rd10 (F), rd10/WT (H),
rd10/hTf (J), and TghTf (L) mice at 3 weeks postnatally.
Nuclei were stained with 4’,6 Diamidino-2-phenyl-indole (DAPI): rd10 (G),
rd10
WT (I), rd10/hTf (K), and TghTf (M).
Abbreviations: GCL is ganglion cell layer; INL is inner nuclear layer;
ONL is outer nuclear layer; RPE is retinal pigmented epithelium. Scale
bars in A-C and F-M equal 100 μm.
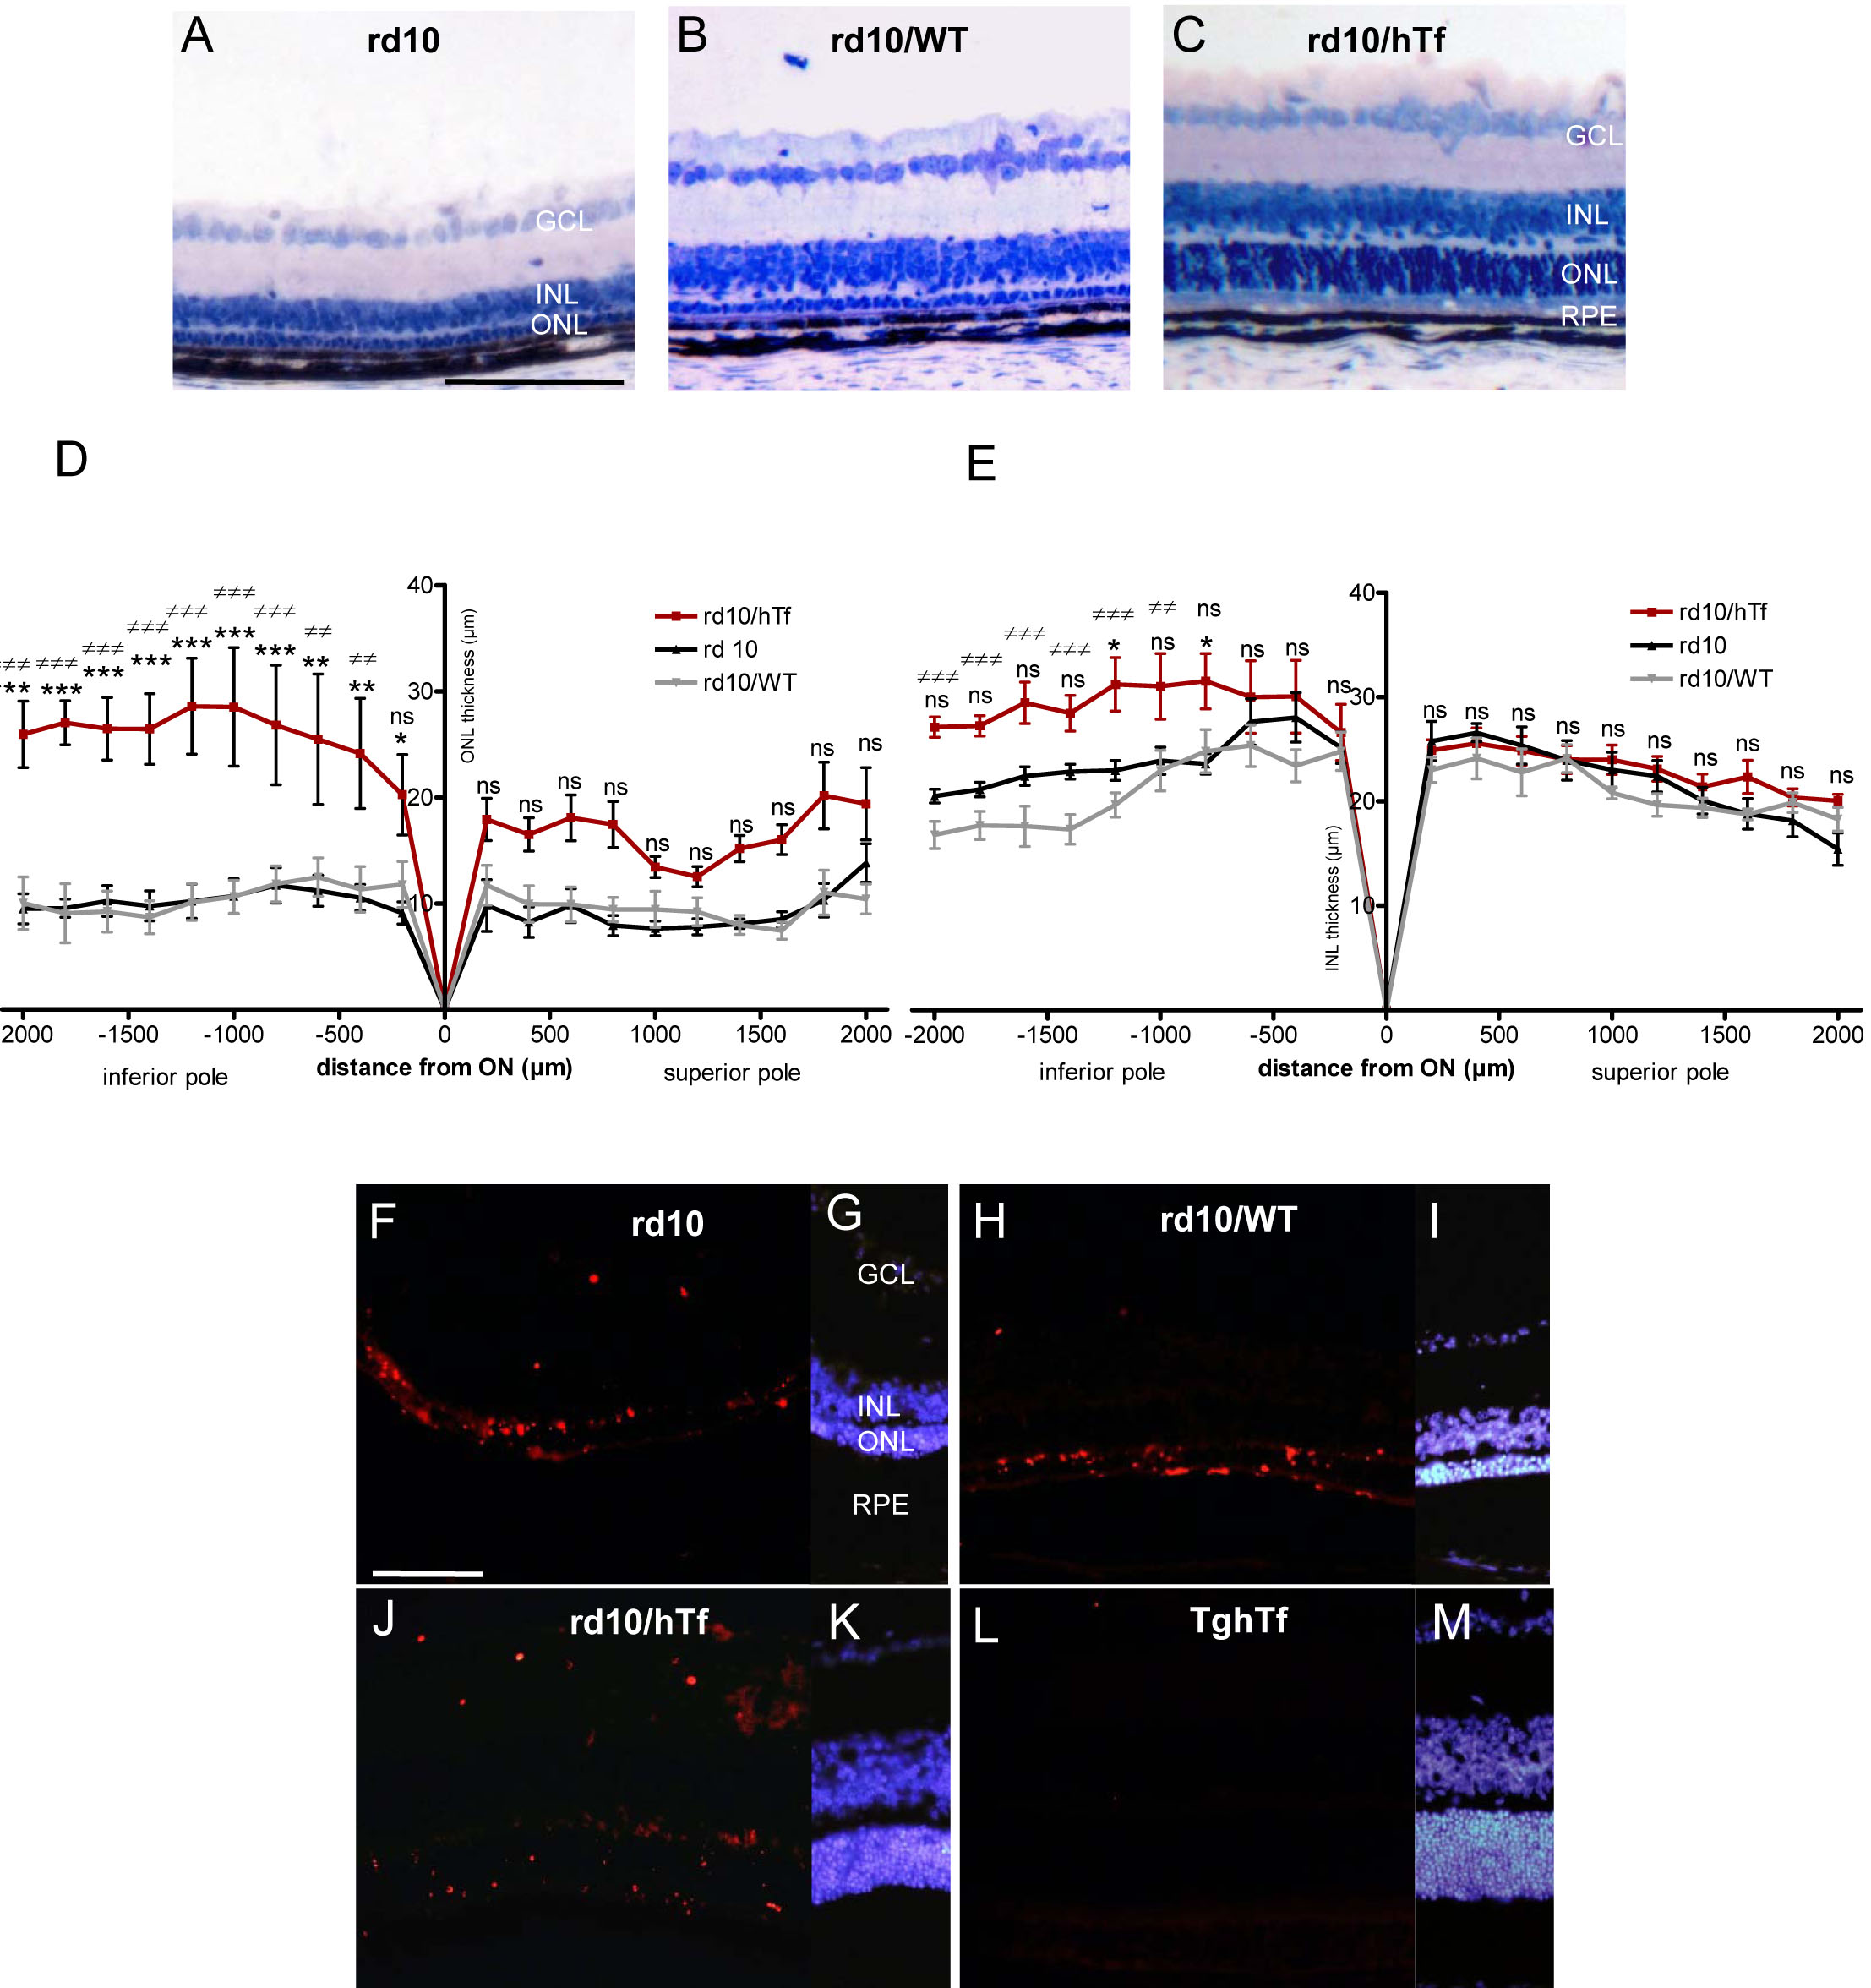
 Figure 4 of Picard, Mol Vis 2010; 16:2612-2625.