Figure 3. Characterization of human
transferrin (hTf) expression in rd10/ hTf mouse. A: Gel
migration of DNA extracted from products of rd10 or rd10/hTf (lane 1),
TghTf (lane 2), and rd10+/−hTf (lane 3) mice use to establish the
genotypes. The homozygous rd10 mutation was revealed by the presence of
1257 and 715 bp bands. The heterozygous mutation had 1257, 715, 661,
and 54 bp bands. The wild-type (WT) had 1257, 661, and 54 bp bands.
Bands 54 bp in size are not visible on the gel. B:
Enzyme-linked immunosorbent assay was used to quantified hTf
concentrations in lysats of neural retinas of rd10, rd10/WT, rd10/hTf,
and TghTf mice. Values were means±SEM n=12; ns means not significant. C-F:
hTf
was immunolocalized on frozen sections of 3-week-old rd10 (D)
and rd10/hTf (E) mouse retinas. Non-immune serum was used as a
control (C). TghTf mouse retina was labeled with anti-CRALBP, a
specific marker for Müller glial cell (F). G-H:
Mouse Tf was immunolocalized on frozen sections of 3-week-old rd10 (G)
and
rd10/hTf (H) mouse retinas. Abbreviations: Ch is choroid;
GCL is ganglion cell layer; INL is inner nuclear layer; IPL is inner
plexiform layer; IS is inner segment; ONL is outer nuclear layer; OPL
is outer plexiform layer; RPE is retinal pigmented epithelium. Scale
bars in C-H equal 50 μm.
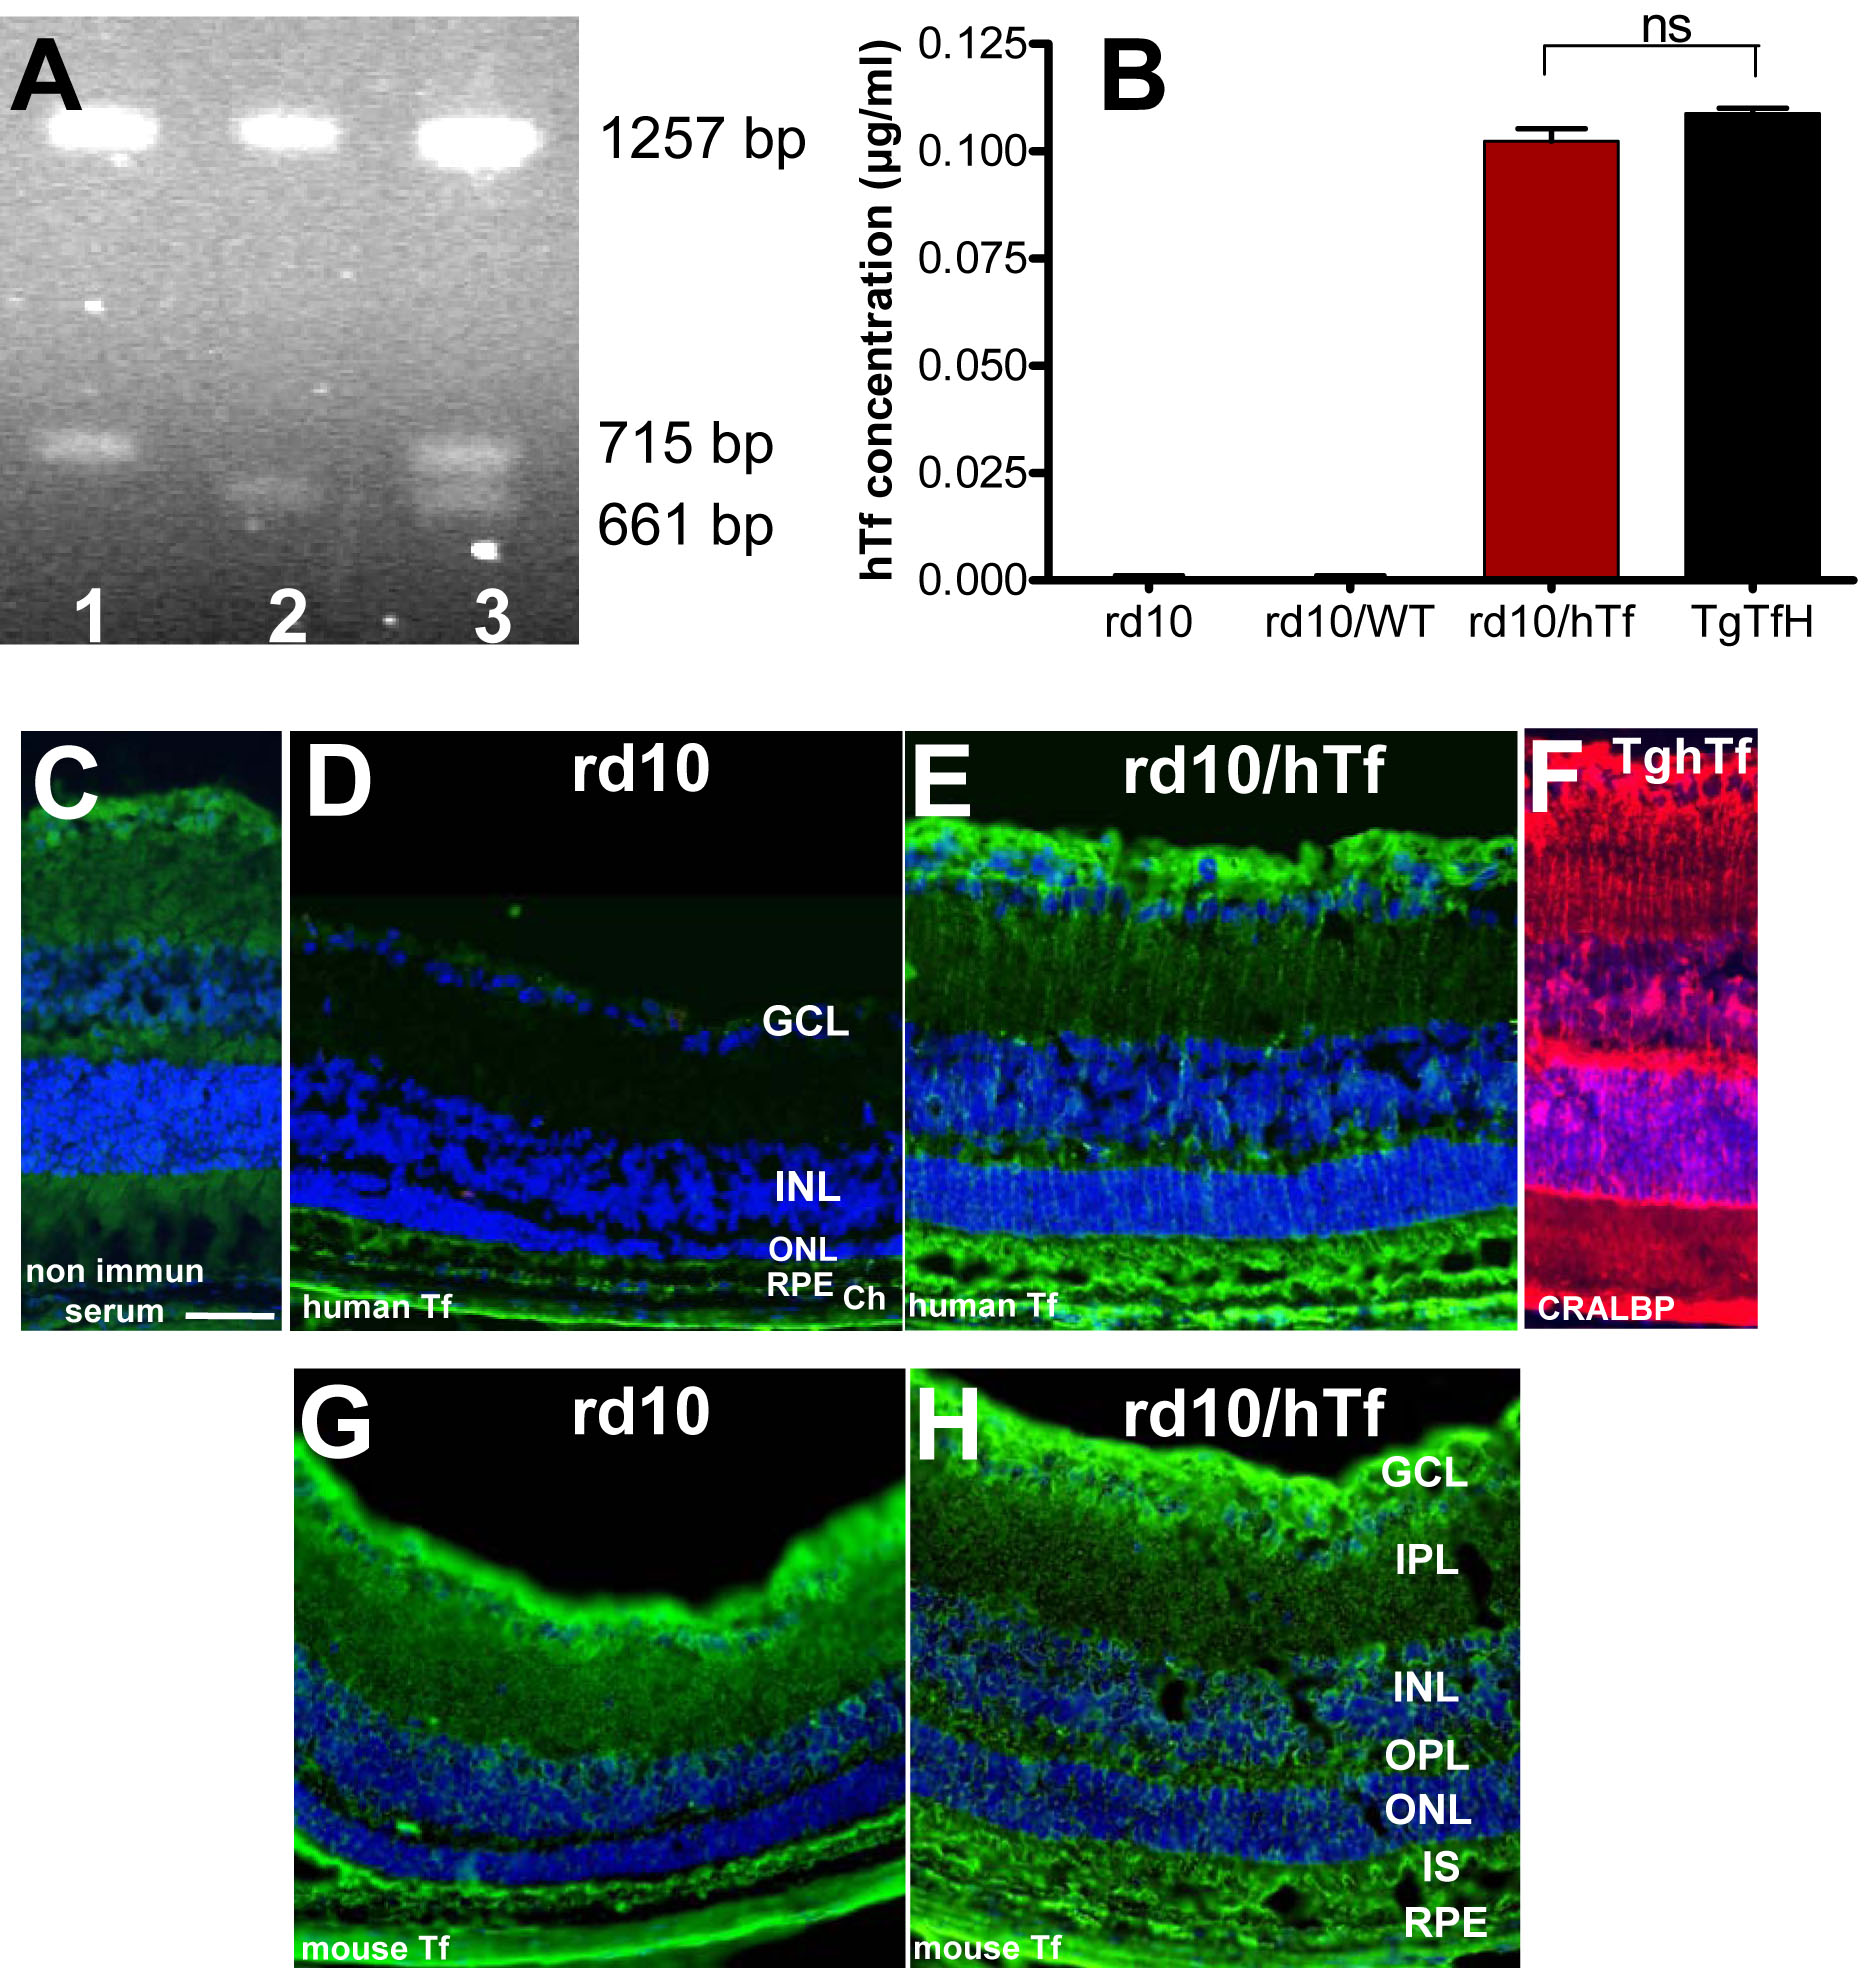
 Figure 3 of Picard, Mol Vis 2010; 16:2612-2625.