Figure 1. Proton-induced X-ray emission
(PIXE) microanalysis of iron and potassium in 2-, 3-, and 4-week-old
rd10 and wild-type mouse retinas. A-B: Concentrations in
μg/g dry weight of potassium (A) and iron (B) correspond
to area of photoreceptor segments from 2-, 3-, and 4-week-old rd10 and
wild-type (WT) mouse retinas. White bar represents WT mice and black
bar rd10 mice. Values were means±SEM (n=7–11; *p<0.05, ** p<0.01,
*** p<0.001; ns: not significant). C-F: Bidimensional
maps represent potassium (C, E) and iron (D, F)
distribution
in 4-week-old WT (C-D) and rd10 (E-F)
mice. Concentrations, expressed in counts per pixel, increase according
to the color scale, from white to black. The different retinal layers
were identified after staining with toluidine blue and are outlined
with dotted lines. Dimension of the scan are 150×150 μm2.
Abbreviations: ch is choriocapillaris; inl is inner nuclear layer; ipl
is inner plexiform layer; is is inner segments of photoreceptors; onl
is outer nuclear layer; opl is outer plexiform layer; os is outer
segments of photoreceptors; rpe is retinal pigmented epithelium; sc is
sclera.
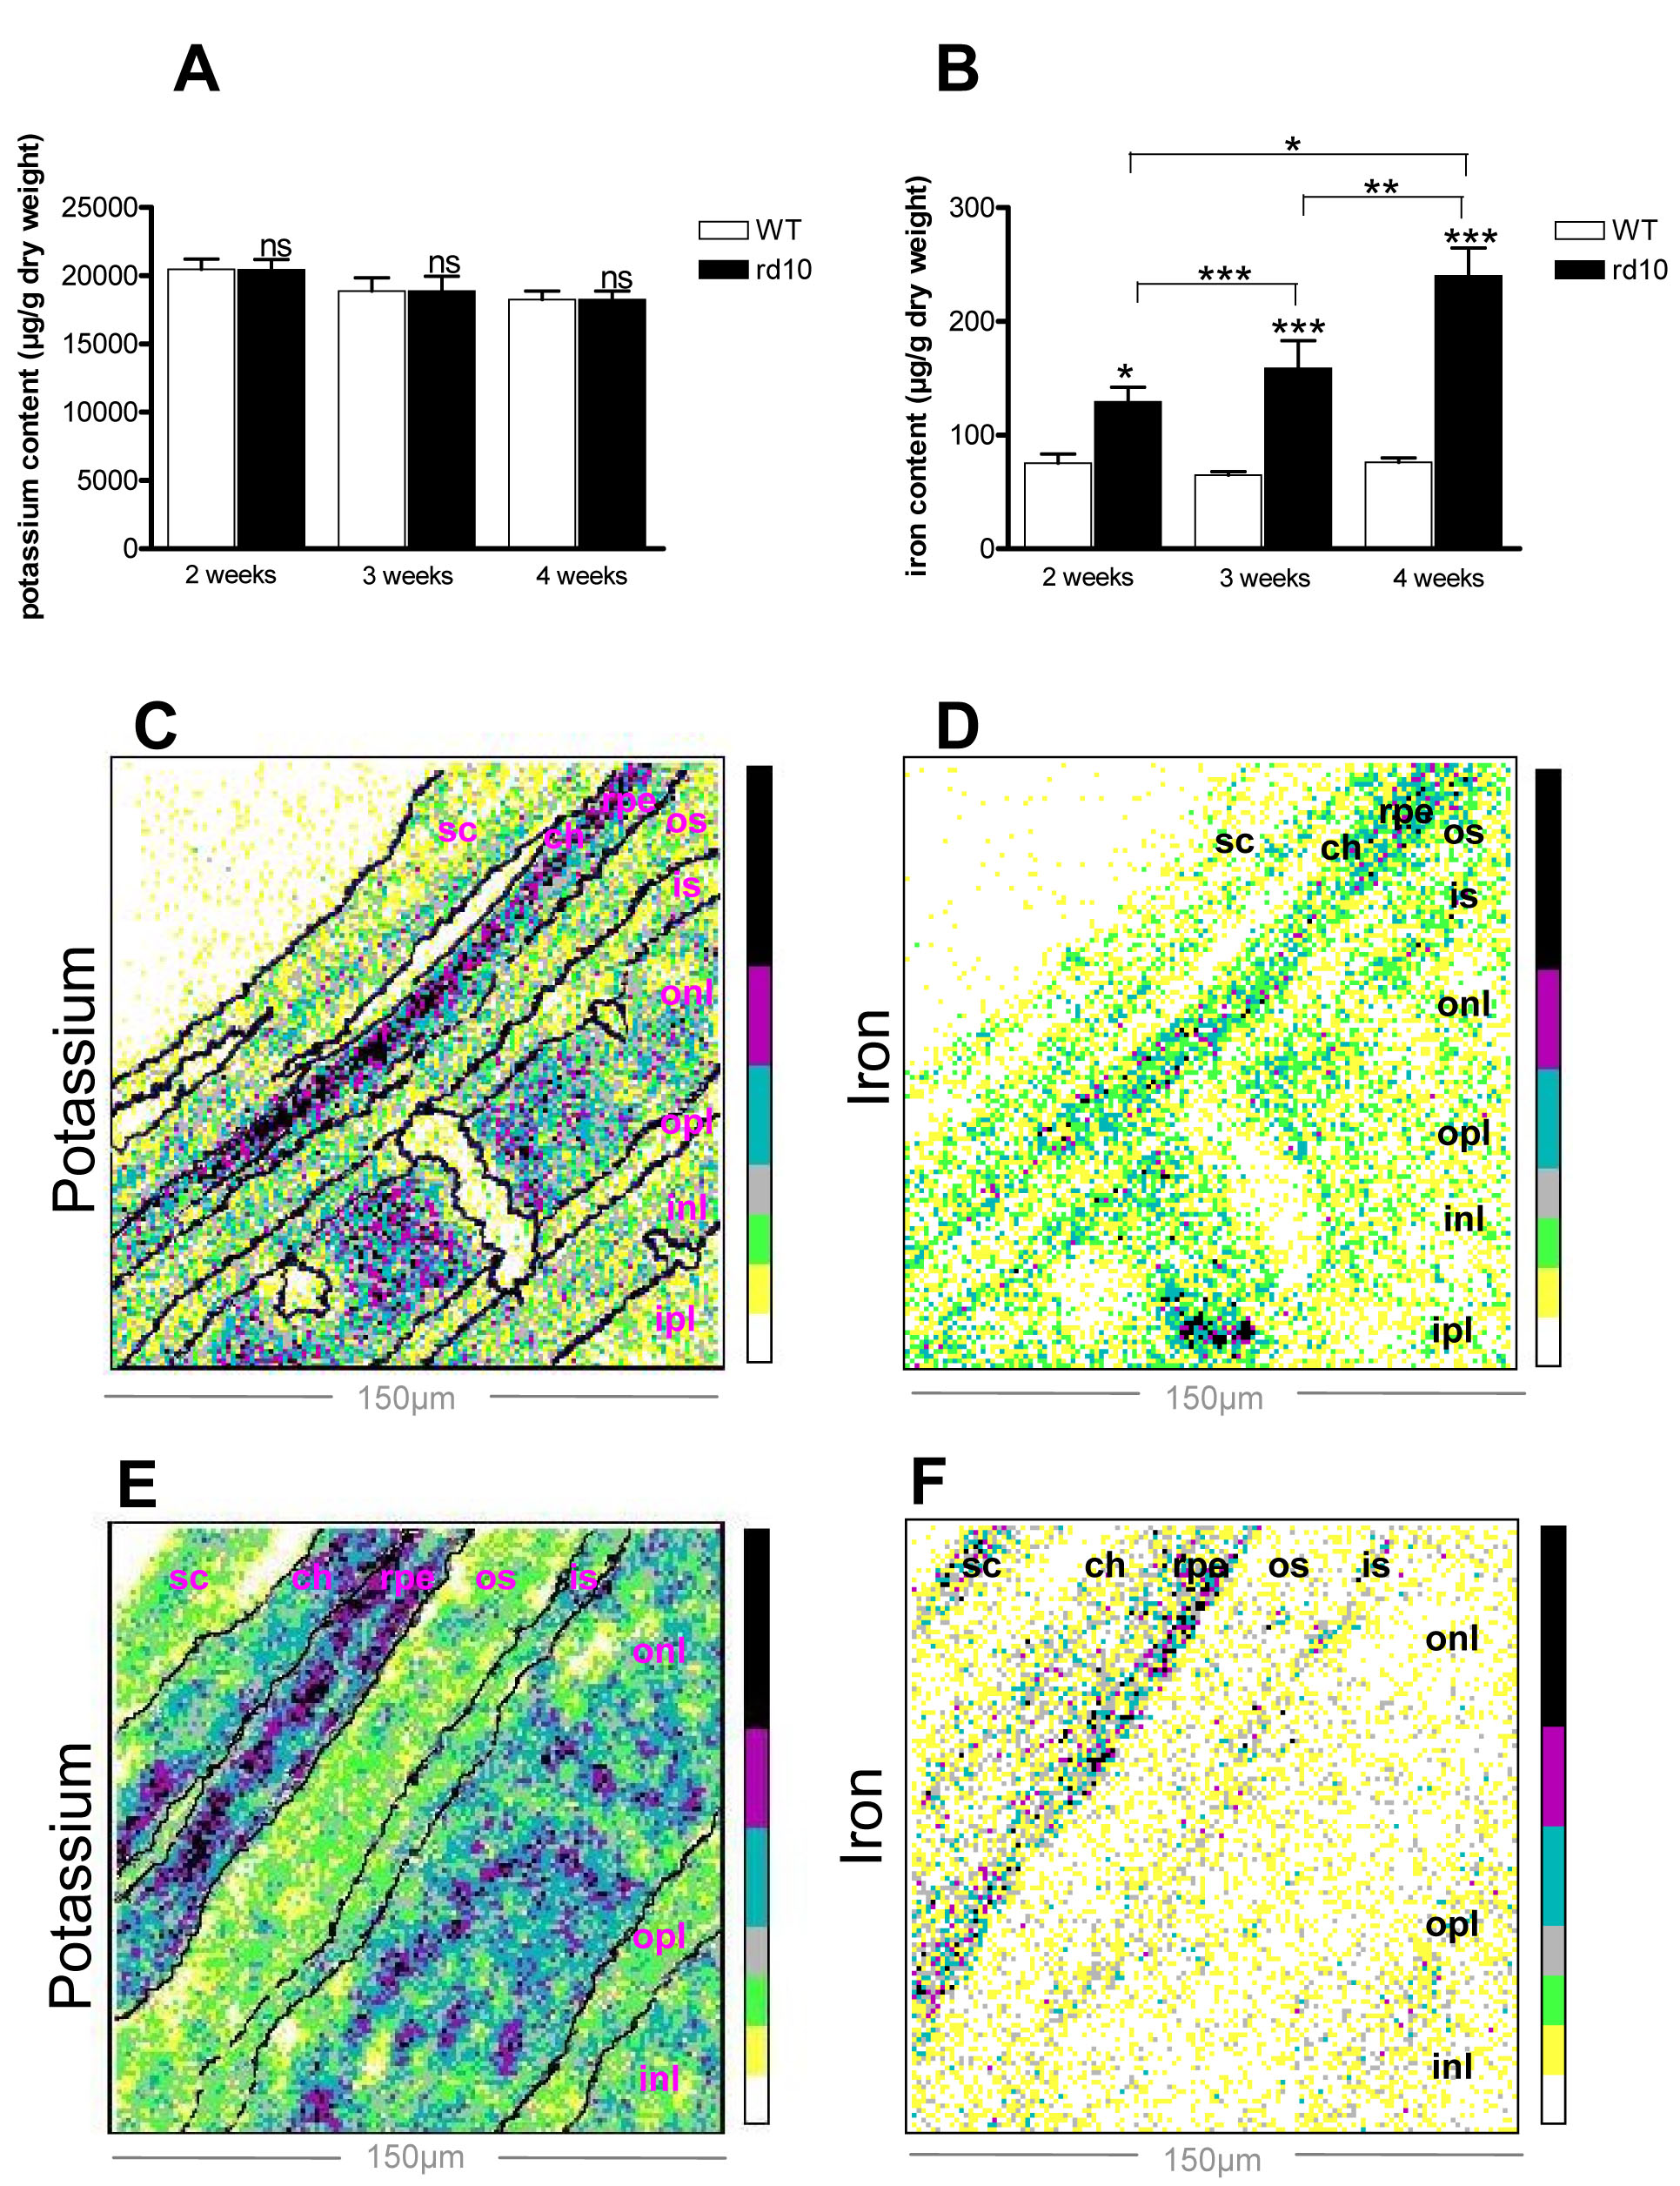
 Figure 1 of Picard, Mol Vis 2010; 16:2612-2625.