Figure 3. Light responsiveness of
PER2::LUC bioluminescence rhythm in RPE-choroid. A: The light
pulse was given at Day 4
of PER2::LUC rhythms. B: The control pulse was given at Day 4
of PER2::LUC rhythms. Arrows indicate the times of the treatment. C:
The
double-plotted
phase response curve to light stimuli in the
PER2::LUC bioluminescence rhythm in the RPE-choroid. Black squares
indicate control and white circles indicate the samples that received
the light pulse. D: Data were divided into 4 bins in 6 h
intervals for statistical analysis. No significant differences were
observed between the control (black bars) and the experimental (white
bars) groups (two-way ANOVA, p>0.1).
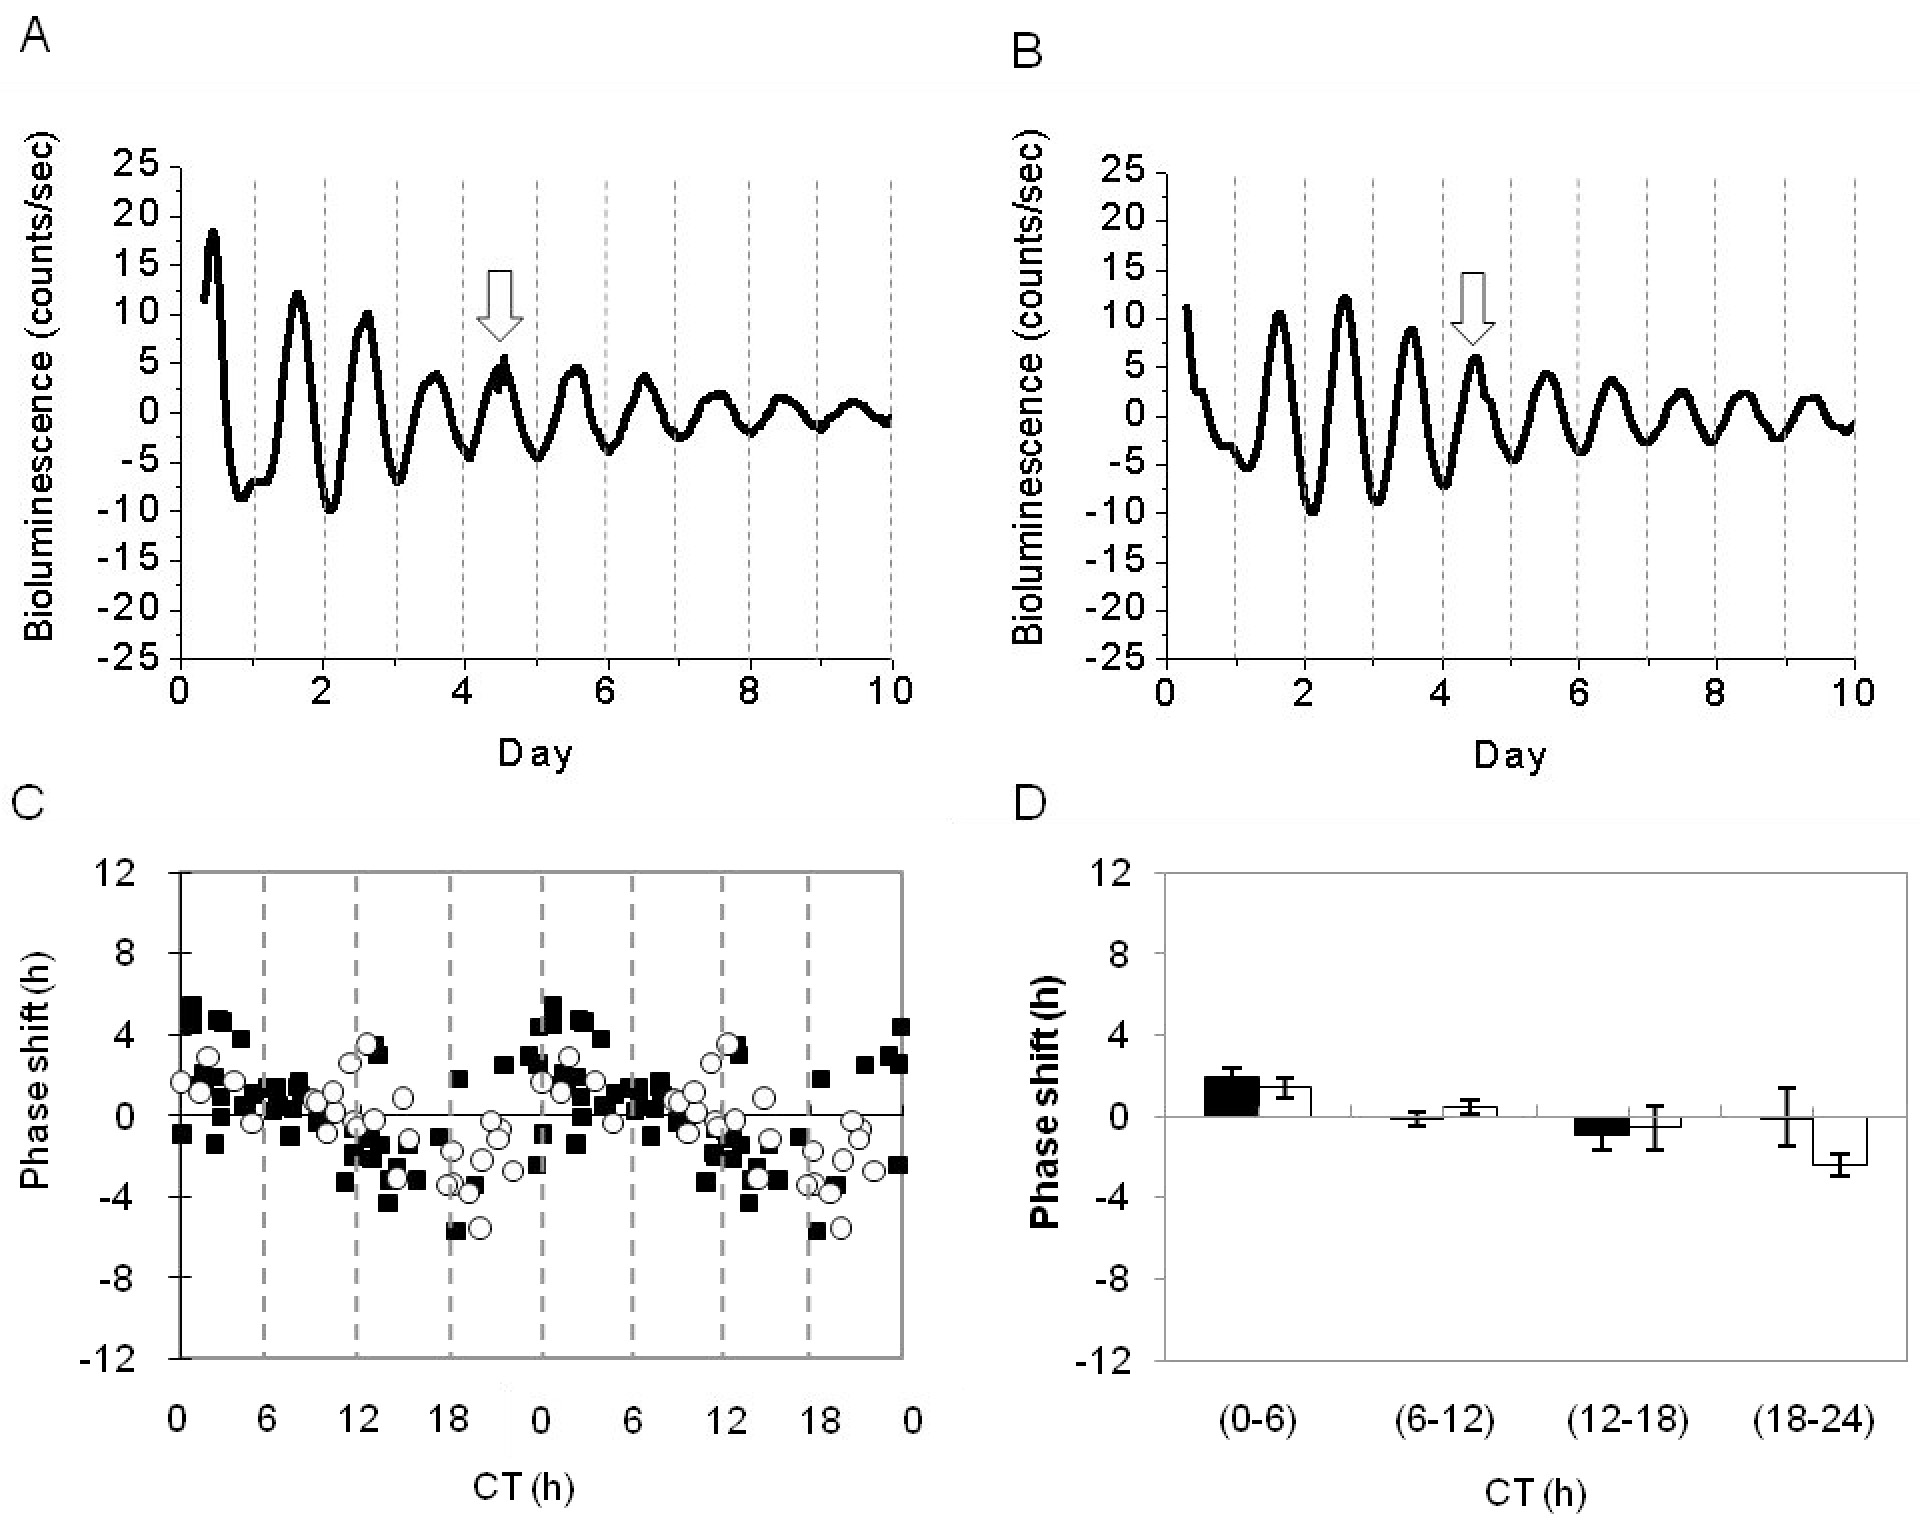
 Figure 3 of Baba, Mol Vis 2010; 16:2605-2611.