Figure 3. R-dystrophin variants in human tissues. A: Semi-quantitative analysis of R-dystrophin variants in the retina and the skeletal muscle. The ratio of each variant/GAPDH
in the retina (R) and the skeletal muscle (M) are shown. A fragment comprising exons R1 to 32 was RT–PCR amplified from the
retina and the skeletal muscle and semi-quantitated. The value was obtained by three quantifications and shown as mean±SD.
In the retina (R), strong expression of R-dys α (α) and β (β) was observed. However, no significant difference between R-dys
α and β was observed (0.70±0.05 and 1.03±0.16, respectively). In the skeletal muscle (M), R-dys α, β and γ (γ) were not detected
but R-dys δ (δ) was observed at the quite low level. B: RT–PCR amplified products are shown. A fragment comprising exons R1 to 32 was RT–PCR amplified from 21 human tissues. Four
products were obtained from the retina (R-dys α, β, γ, and δ) but R-dys α and β were the main products. R-dys α was also identified
weakly in the cerebellum. R-dys β was present in several tissues including the adrenal gland. MK refers to the size marker
(DNA 1000 Markers).
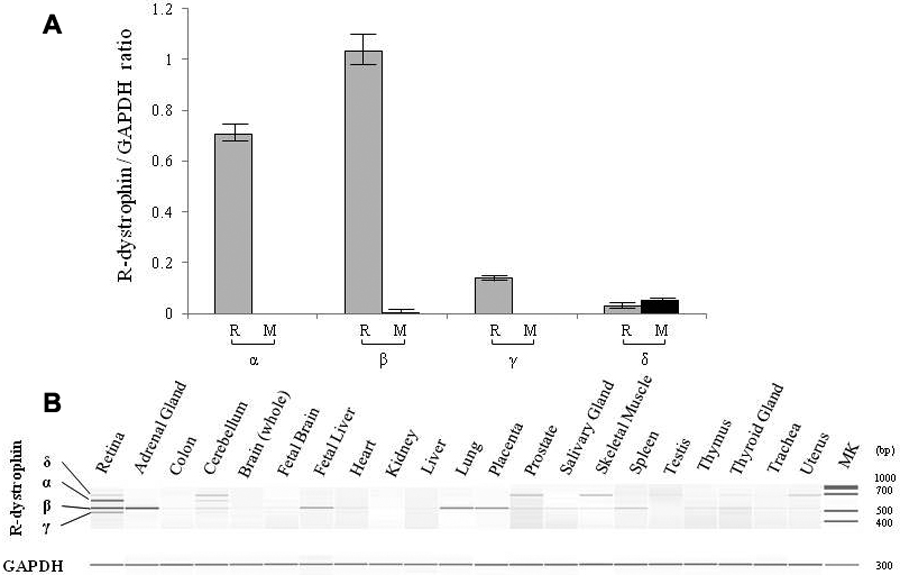
 Figure 3 of
Kubokawa, Mol Vis 2010; 16:2590-2597.
Figure 3 of
Kubokawa, Mol Vis 2010; 16:2590-2597.