Figure 1. Reverse transcription polymerase chain reaction (RT–PCR) amplification of the R-dystrophin transcript. A: Schematic description of the region encompassing exons R1 to 32 of the dystrophin (DMD) gene. RT–PCR primers (RdysF-N119, Rdys-F and 2F) are shown as horizontal arrows. Boxes and bars indicate exons and introns,
respectively. Exon/intron structures are described according to previous studies and the present study above and below the
line, respectively. In this study, exon R1 is divided into three segments: the boxes labeled R1A (horizontal-lined), IR1A
(black) and R1B (vertical bold-lined) represent exon R1A (93 bp), intron R1A (98 bp) and exon R1B (45 bp), respectively. Intron
R1 was also incorporated into the mRNA (oblique-lined box). Numbers within the boxes indicate the exon number. The actual
lengths of exon R1 and intron R1 are 236 bp and 105 bp, respectively. B: RT–PCR-amplified products of the fragment encompassing exons R1 to 32. Amplification from the retina using the conventional
primer RdysF-N119 revealed one clear band of 529 bp (R-dys α; right). In contrast, RT–PCR amplification using the outer forward
primer Rdys-F revealed three bands: two major products of 636 bp and 538 bp (R-dys α and β, respectively) and one weak product
of 493 bp (R-dys γ; left). In addition, sequencing of subclones revealed an additional, larger product (R-dys δ). The exon
structure of each product is described in the middle of each panel. The four R-dystrophin transcripts are shown by four bars.
A fragment of GAPDH (302 bp) was amplified as a control (bottom). MK refers to the size marker (φX174 HaeIII digest).
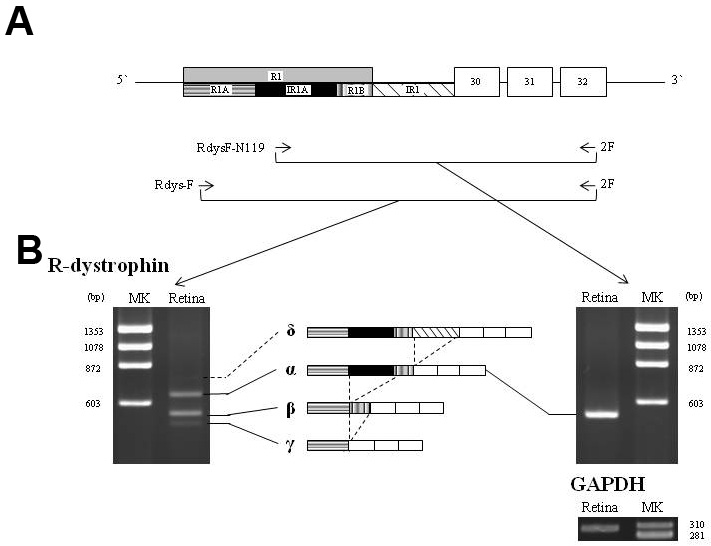
 Figure 1 of
Kubokawa, Mol Vis 2010; 16:2590-2597.
Figure 1 of
Kubokawa, Mol Vis 2010; 16:2590-2597.