Figure 3. Verification of the specificity
of the anti-CERKL antibody RA. A: Western blot analysis of
mouse retinal extract with the affinity-purified RA antibody. The
antibody detects a main specific band, which corresponds to the
expected size of the primary and most abundant CERKL isoform in the
adult mouse retina (isoform a’, 58 kDa). Two additional fainter
bands slightly higher than 51 kDa, corresponding to isoforms b’
and c’ (55 and 53 kDa, respectively), can also be observed. All
three bands are completely absent following pre-absorption of the RA
antibody with the recombinant CERKL protein (right panel), but not with
a non-specific protein (BSA; left panel). B: Western blot
analysis of extracts from bacteria transformed with mouse Cerkl
retinal isoforms a’ (58 kDa), b’ (55 kDa), and d’
(12 kDa). The RA antibody detects proteins of the expected sizes
in IPTG-induced, but not in un-induced bacterial extracts. C:
Western blot analysis of protein extracts from the ARPE-19 and 661W
cell lines. In the mouse-derived cell line, 661W, a major band of
approximately 58 kDa, which corresponds to mouse CERKL isoform a’
is detected. In the human-derived cell line, ARPE-19, two bands
corresponding to human CERKL isoforms c and d (46 and 51 kDa,
respectively) are detected. D: Immunostaining of ARPE-19 cells
is omitted following pre-absorption of the RA antibody (green) with the
recombinant CERKL protein (right panel), but not with a non-specific
protein (BSA; left panel). Nuclei are stained with TO-PRO-3 (blue).
Scale bar, 20 µm. E: Immunostaining of a mouse retina section
is omitted following pre-absorption of the RA antibody (green) with the
recombinant CERKL protein (right panel), but not with a non-specific
protein (BSA; left panel). Nuclei are stained with TO-PRO-3 (blue).
Scale bar, 20 µm.
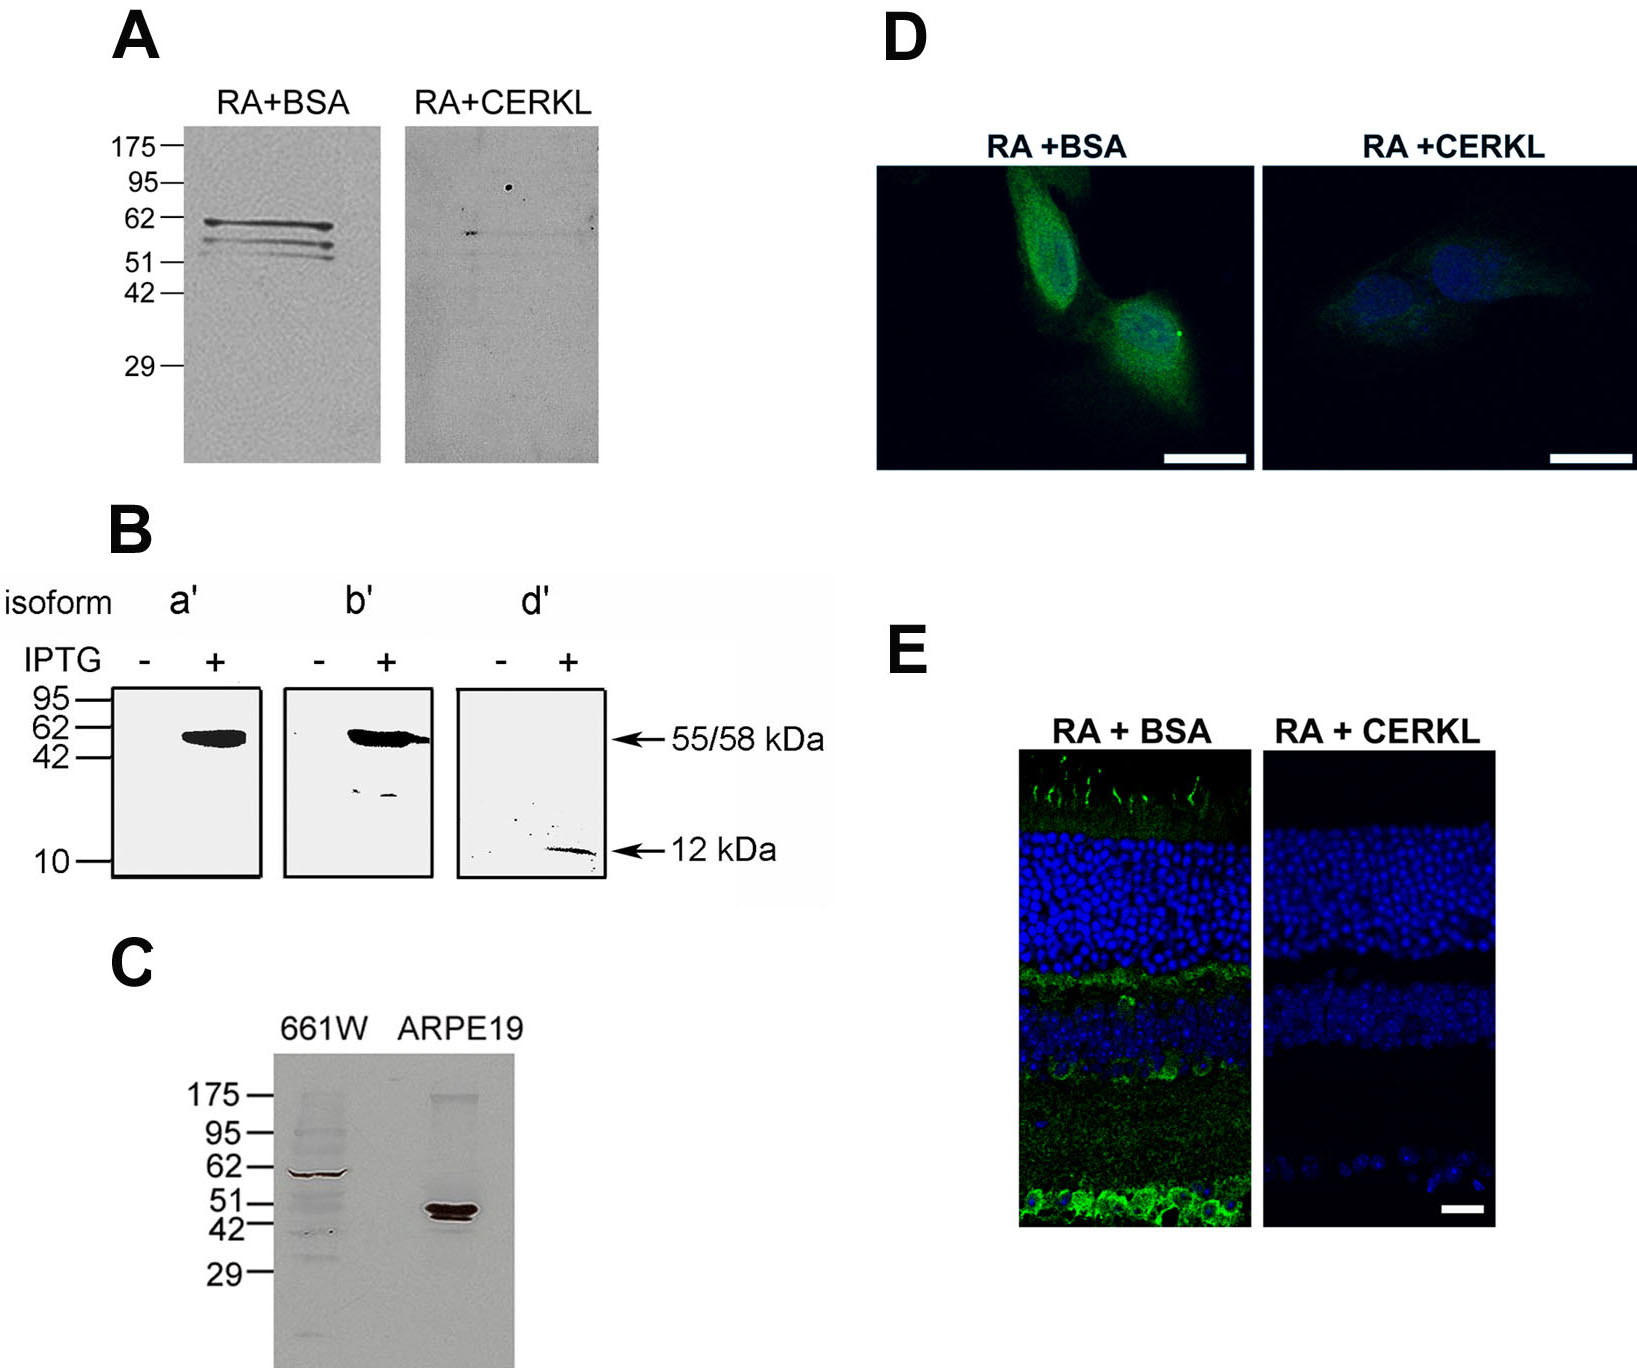
 Figure 3 of Vekslin, Mol Vis 2010; 16:2539-2549.