Figure 9. Fluorescence-activated cell sorting (FACS) analysis of apoptosis in human Muller (MIO-M1) cells incubated with Nε-(3-formyl-3,4-dehydropiperidino)lysine
(FDP-lysine) human serum albumin (HSA) measured using fluorescein isothiocyanate (FITC)-labeled annexin V and PI. A: Representative scatter plots showing the distribution of annexin V and PI staining for control and FDP-lysine-HSA-treated
MIO-M1 cells. Cells are classified as “viable” (bottom left), “apoptotic” (bottom right), or “necrotic” (top left and right).
Cells exposed to 0.5 mg/ml FDP-lysine HSA showed a distinct shift into the bottom right quadrant, consistent with apoptosis
(B). Quantitative analysis of the percentage of viable, apoptotic, or necrotic cells by FACS analysis. *** p<0.001 versus untreated
cells.
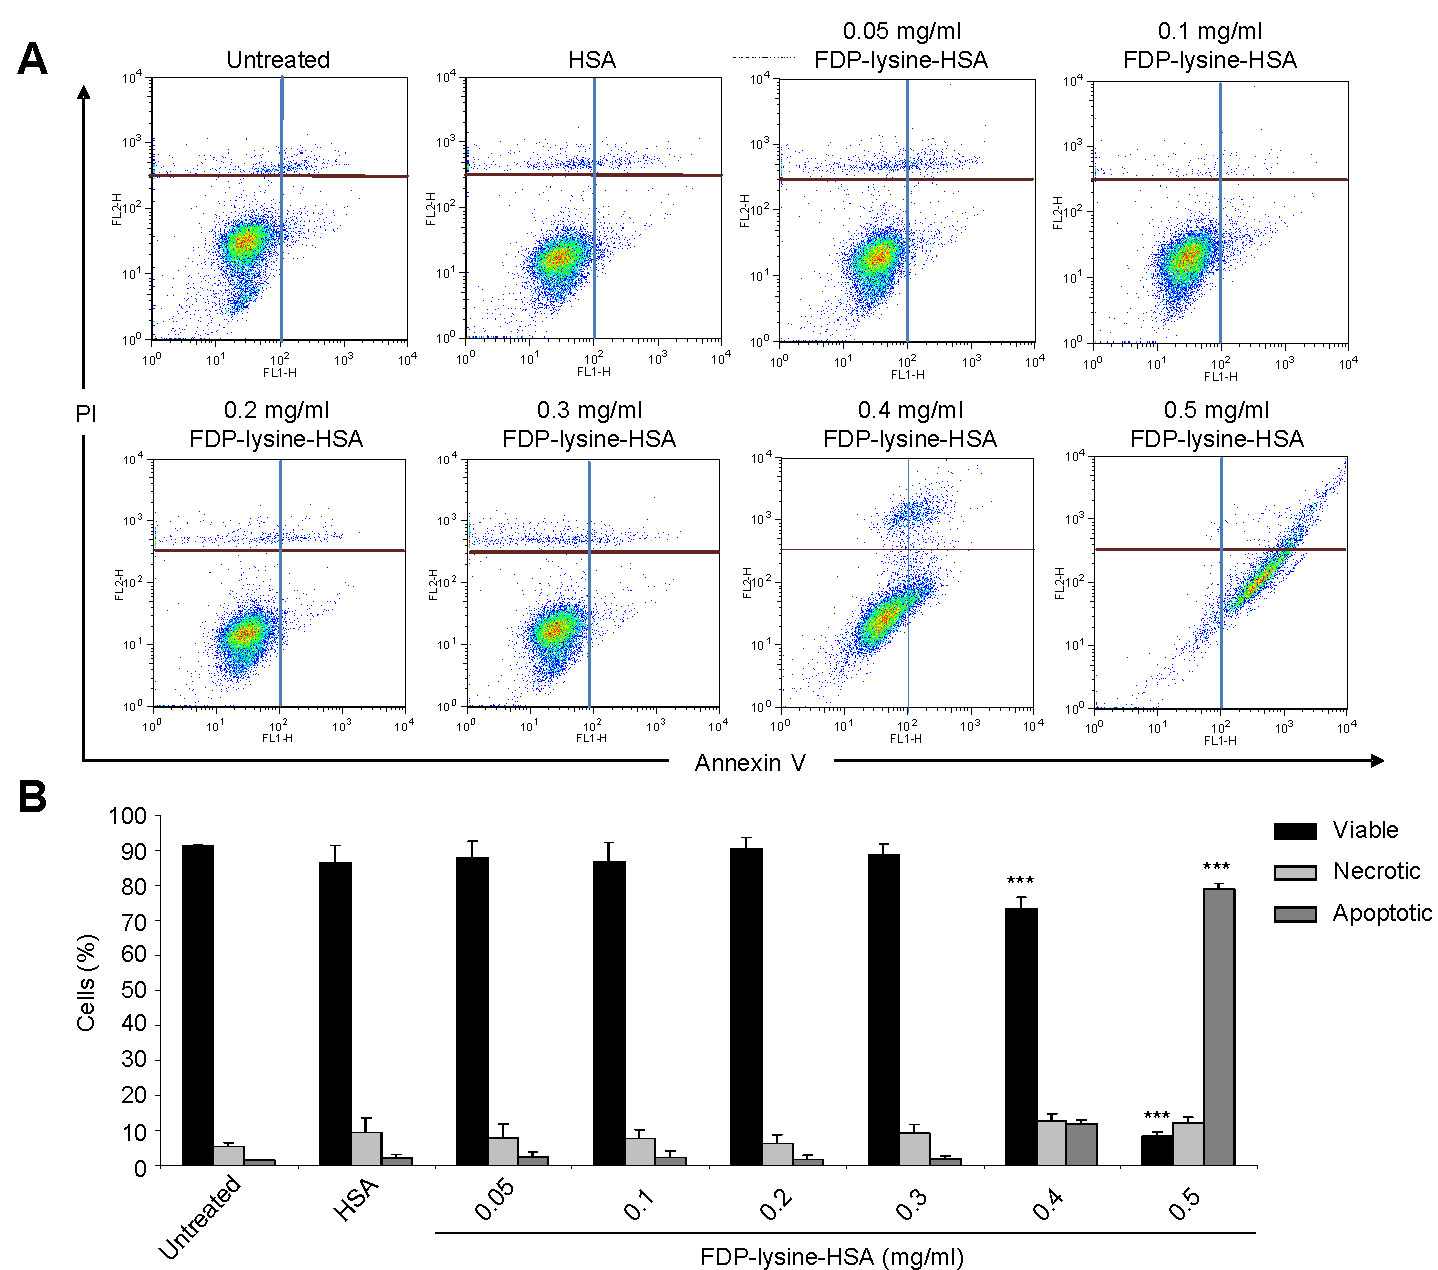
 Figure 9 of
Yong, Mol Vis 2010; 16:2524-2538.
Figure 9 of
Yong, Mol Vis 2010; 16:2524-2538.