Figure 4. Dexmethasone-induced decreasing expression of RhoGDI and increasing expression of RhoA in human trabecular meshwork cells.
A: 2-DE gel images showed RhoGDI spots (arrow head) of TMCs cultured with or without DEX. The spot, identified as RhoGDI by
MALDI-TOF-MS, became weak in 1 μm DEX-treated TMCs. B: Western blotting analysis using an antibody against RhoGDI indicated the decreasing expression of RhoGDI in TMCs cultured
in DEX for 48 h. C: The same sample in B was used to determine the expression of RhoA. A DEX-dose dependent decreasing expression of RhoA was
shown in TMCs treated with DEX for 48 h. Both panel B and C western blotting analyses were repeated three to four times. The data under the western blotting photos were calculated and
are shown as the average ratio of each band compared to that of the non-DEX-treated cells. Immunocytochemical staining revealed
that RhoGDI displayed weaker expression in DEX-treated TMCs (E) than did the cells without DEX (D). Image F was a mock staining control.
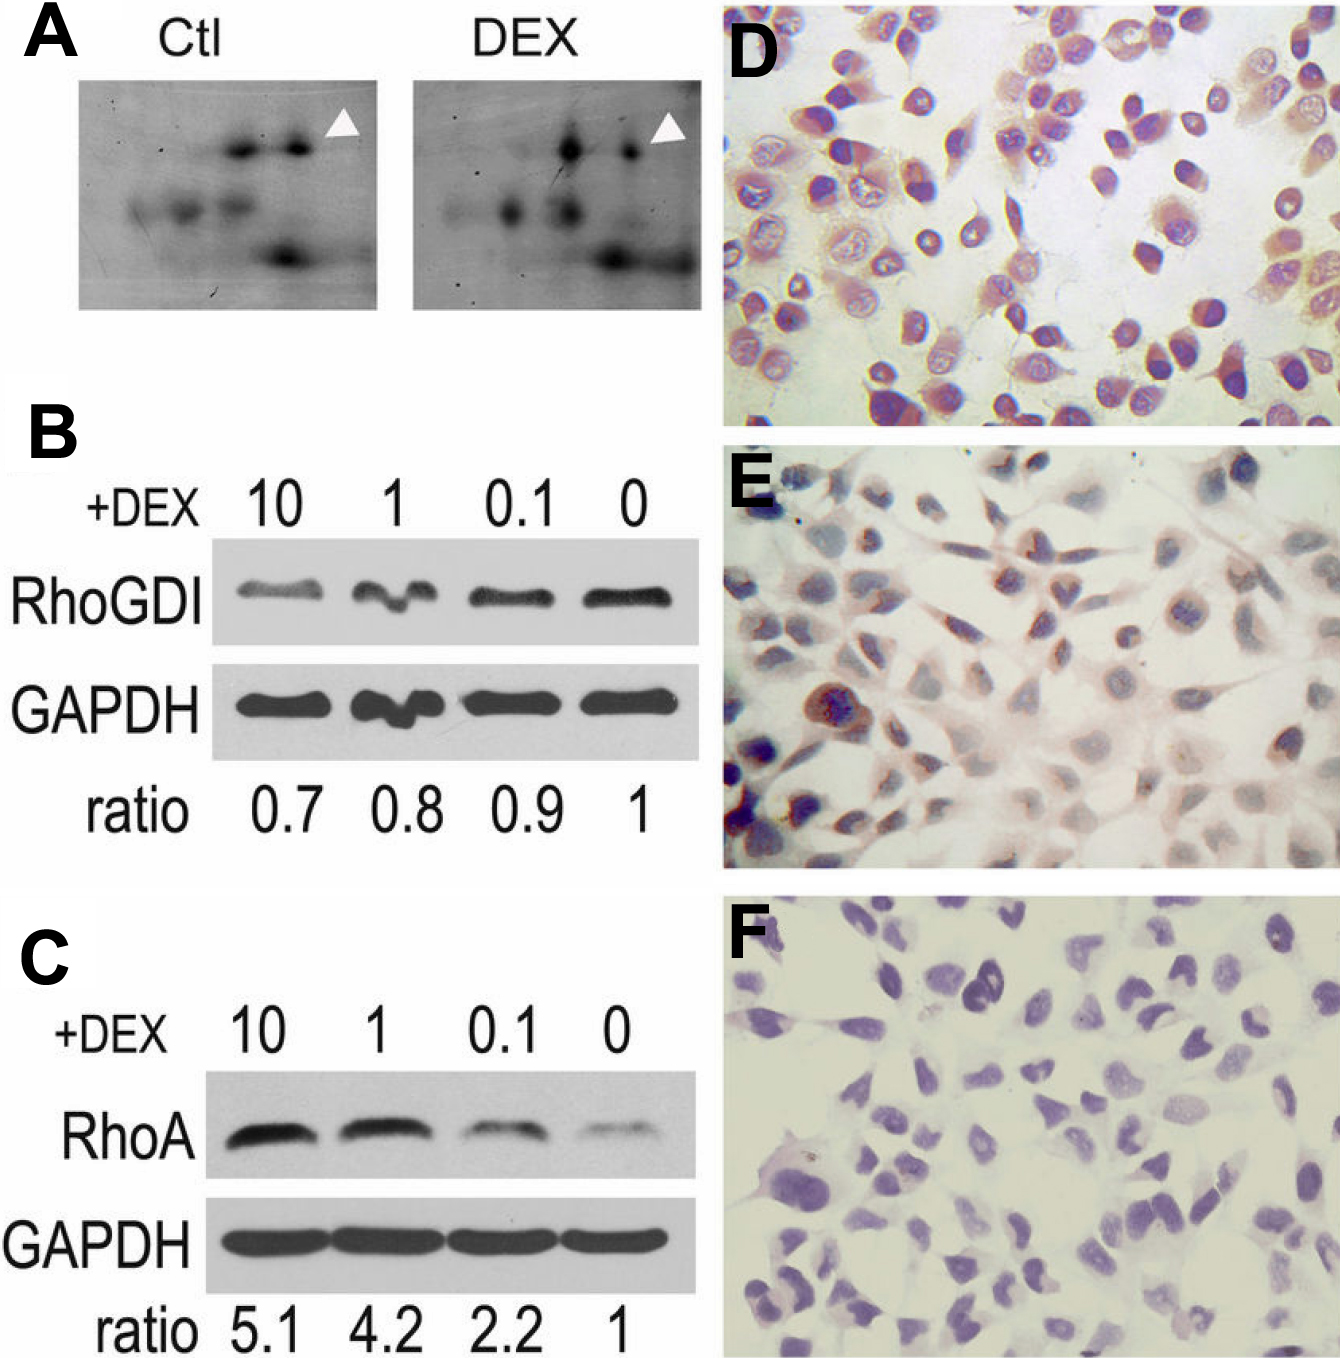
 Figure 4 of
Yu, Mol Vis 2010; 16:213-223.
Figure 4 of
Yu, Mol Vis 2010; 16:213-223.