Figure 5. Immunoblot data for nestin and
synemin. A: Very faint bands of nestin were visible at 1 day
and this increased at 7 days; no band was observed in control retinas
(250 kDa). Only one band at the appropriate molecular weight for
nestin was observed, confirming antibody specificity. Lightly labeled
synemin bands appeared in control tissue with a steady increase between
1 and 3 days of injury and a strong increase by 7 days (arrows). B:
Two
primary bands (arrows) were detected for synemin, corresponding to
the presence and specificity of the antibody for both the H and M
isoforms (225 kDa, 175 kDa). The internal control
glyceraldehyde phosphate dehydrogenase (35 kDa) was used to ensure
equal protein loading.
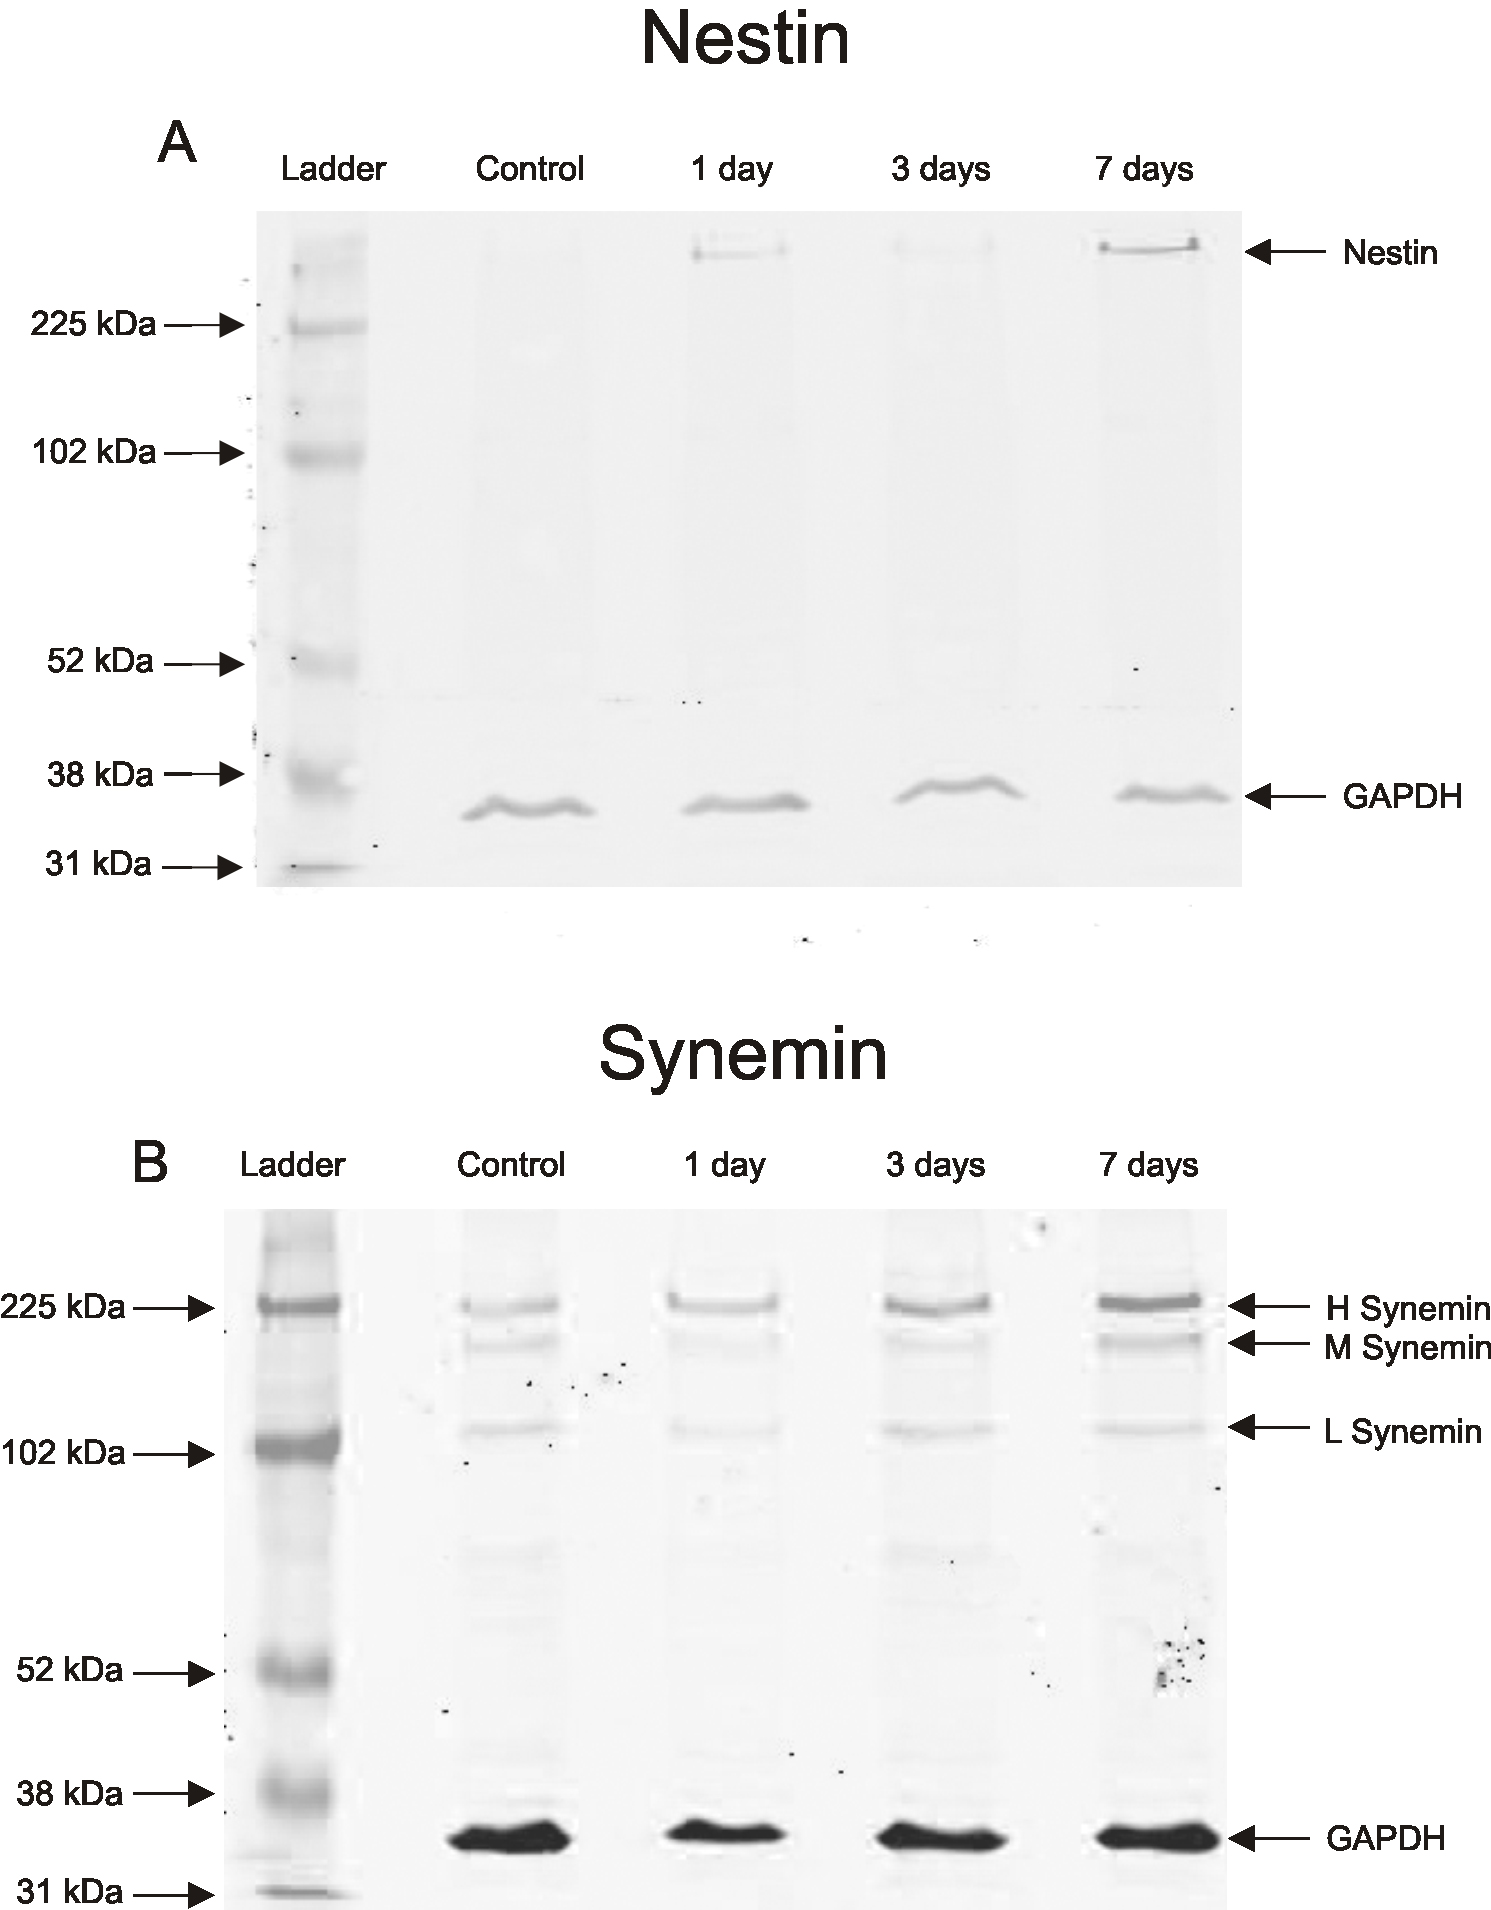
 Figure 5 of Luna, Mol Vis 2010; 16:2511-2523.