Figure 4. Real-time quantitative PCR gene
expression analysis for control (left eyes, white bars) and injured
retinas (right eyes, black bars). For each graph, the levels of gene
expression for nestin (A), synemin (B), glial fibrillary
acidic protein (GFAP; C), and vimentin (D) were
normalized relative to the geometric mean of the four housekeeping
genes: glyceraldehyde phosphate dehydrogenase, glucose phosphate
isomerase, TATA box binding protein, and ubiquitin C. In general, mRNA
levels were elevated at all injury time points. The p value shown for
the average data was computed using a paired two-tailed Student t
test (n=3). In this study, values of 0.01 or higher were considered
statistically significant. Error bars denote standard deviations (SD).
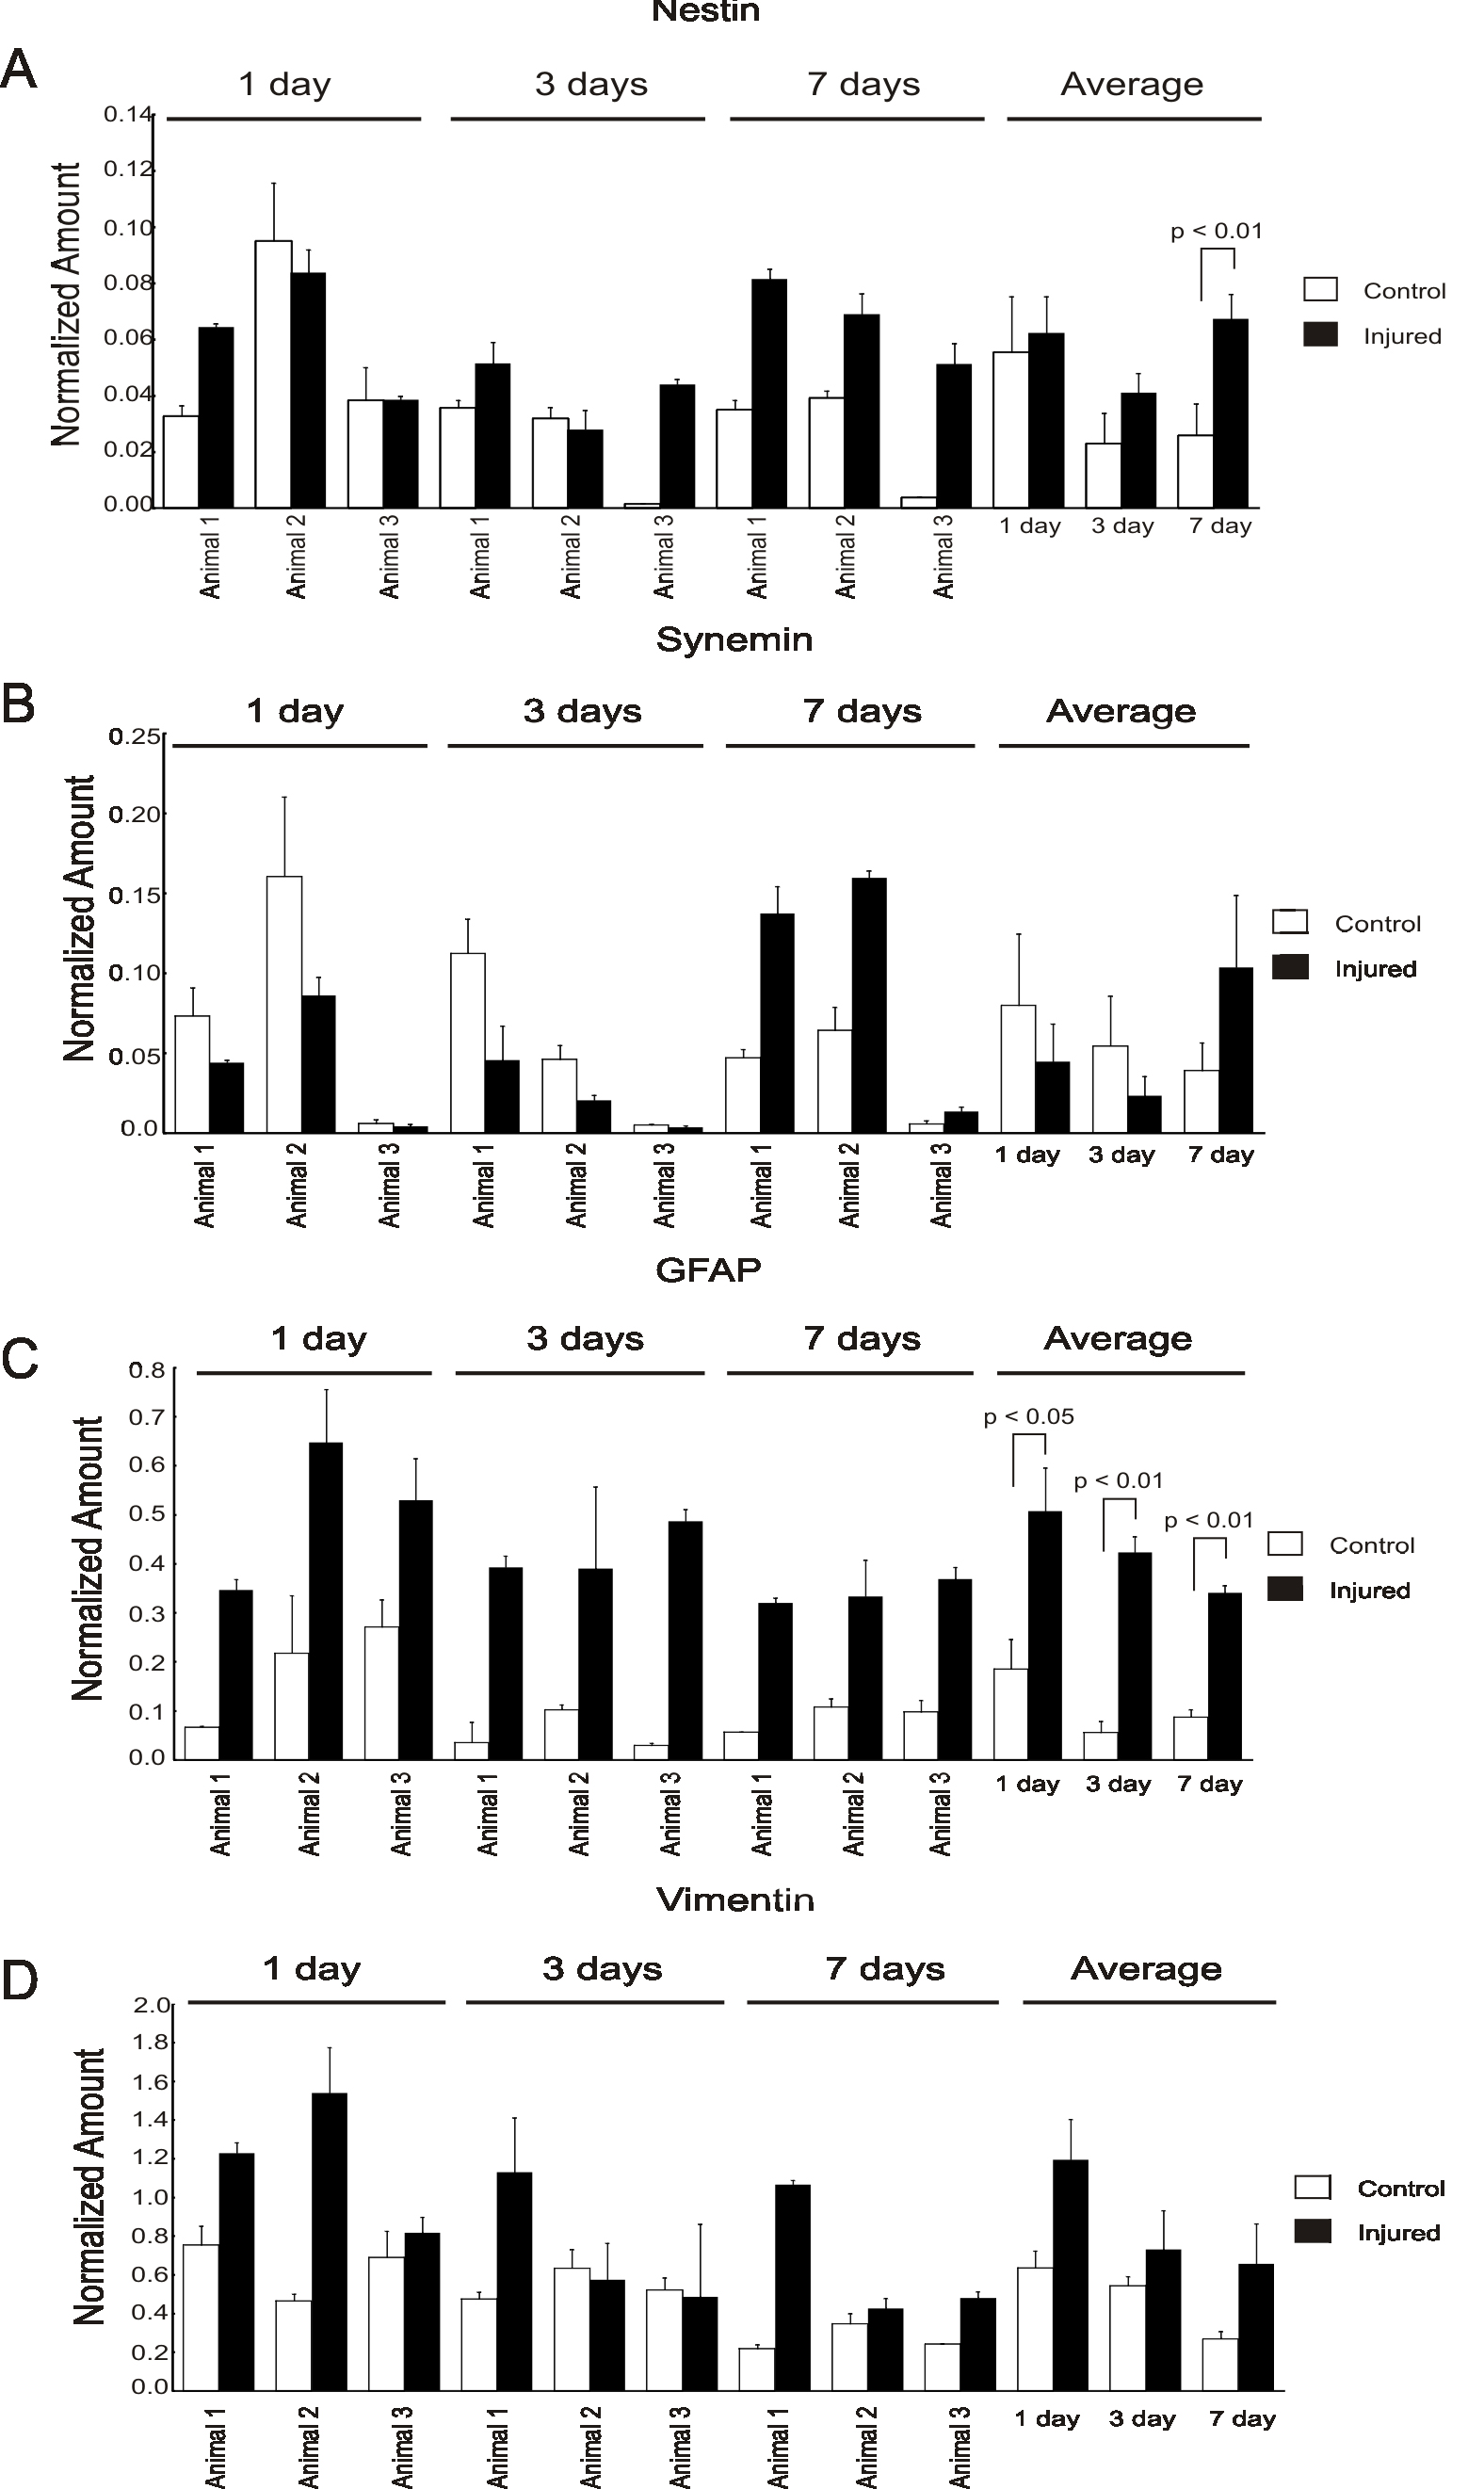
 Figure 4 of Luna, Mol Vis 2010; 16:2511-2523.