Figure 6. Representative
immunohistochemistry images showing CD11b+ cells in naive and
AAV-treated mouse corneas subjected to warm air and collected on day 14
after vector application. A: Naive. B: 20 s. C:
30 s. D: 50 s. DAPI stained nuclei are shown in blue and CD11b+
cells are shown in red. Scale bar denotes 50 µm.
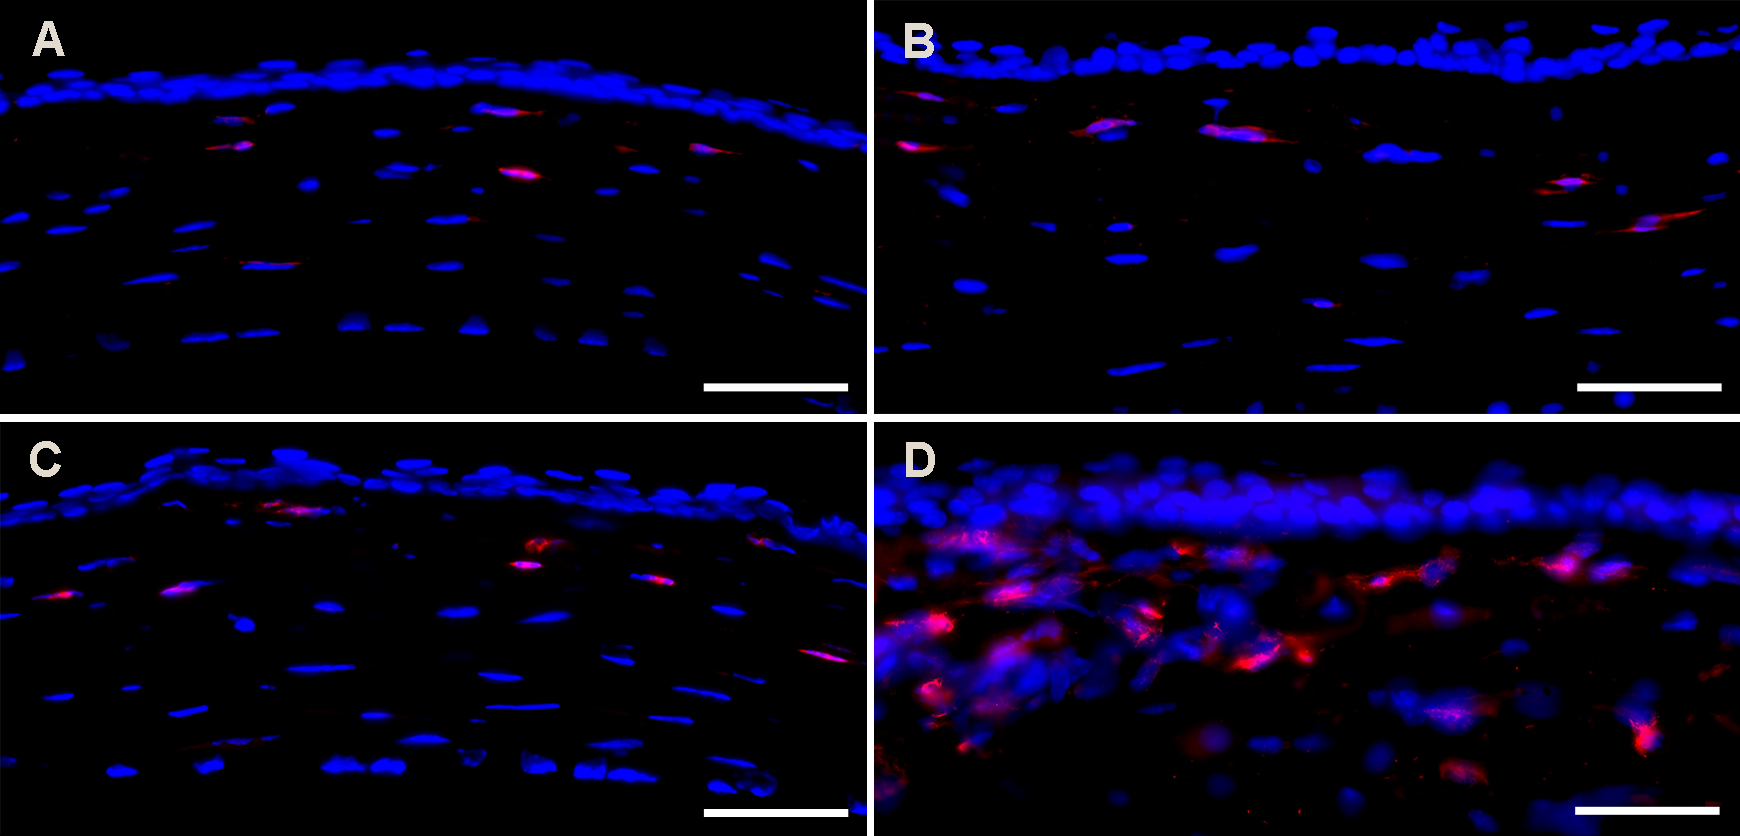
 Figure 6 of Mohan, Mol Vis 2010; 16:2494-2501.