Figure 1. Representative spectra of the
C18T assay. The arrowhead indicates the unextended primer. The bold
arrow indicates the wild type allele (C18). The thin arrow indicates
the potential location of the mutated allele (C18T). Top panel: A
template-free control sample. Bottom panel: Wild type allele.
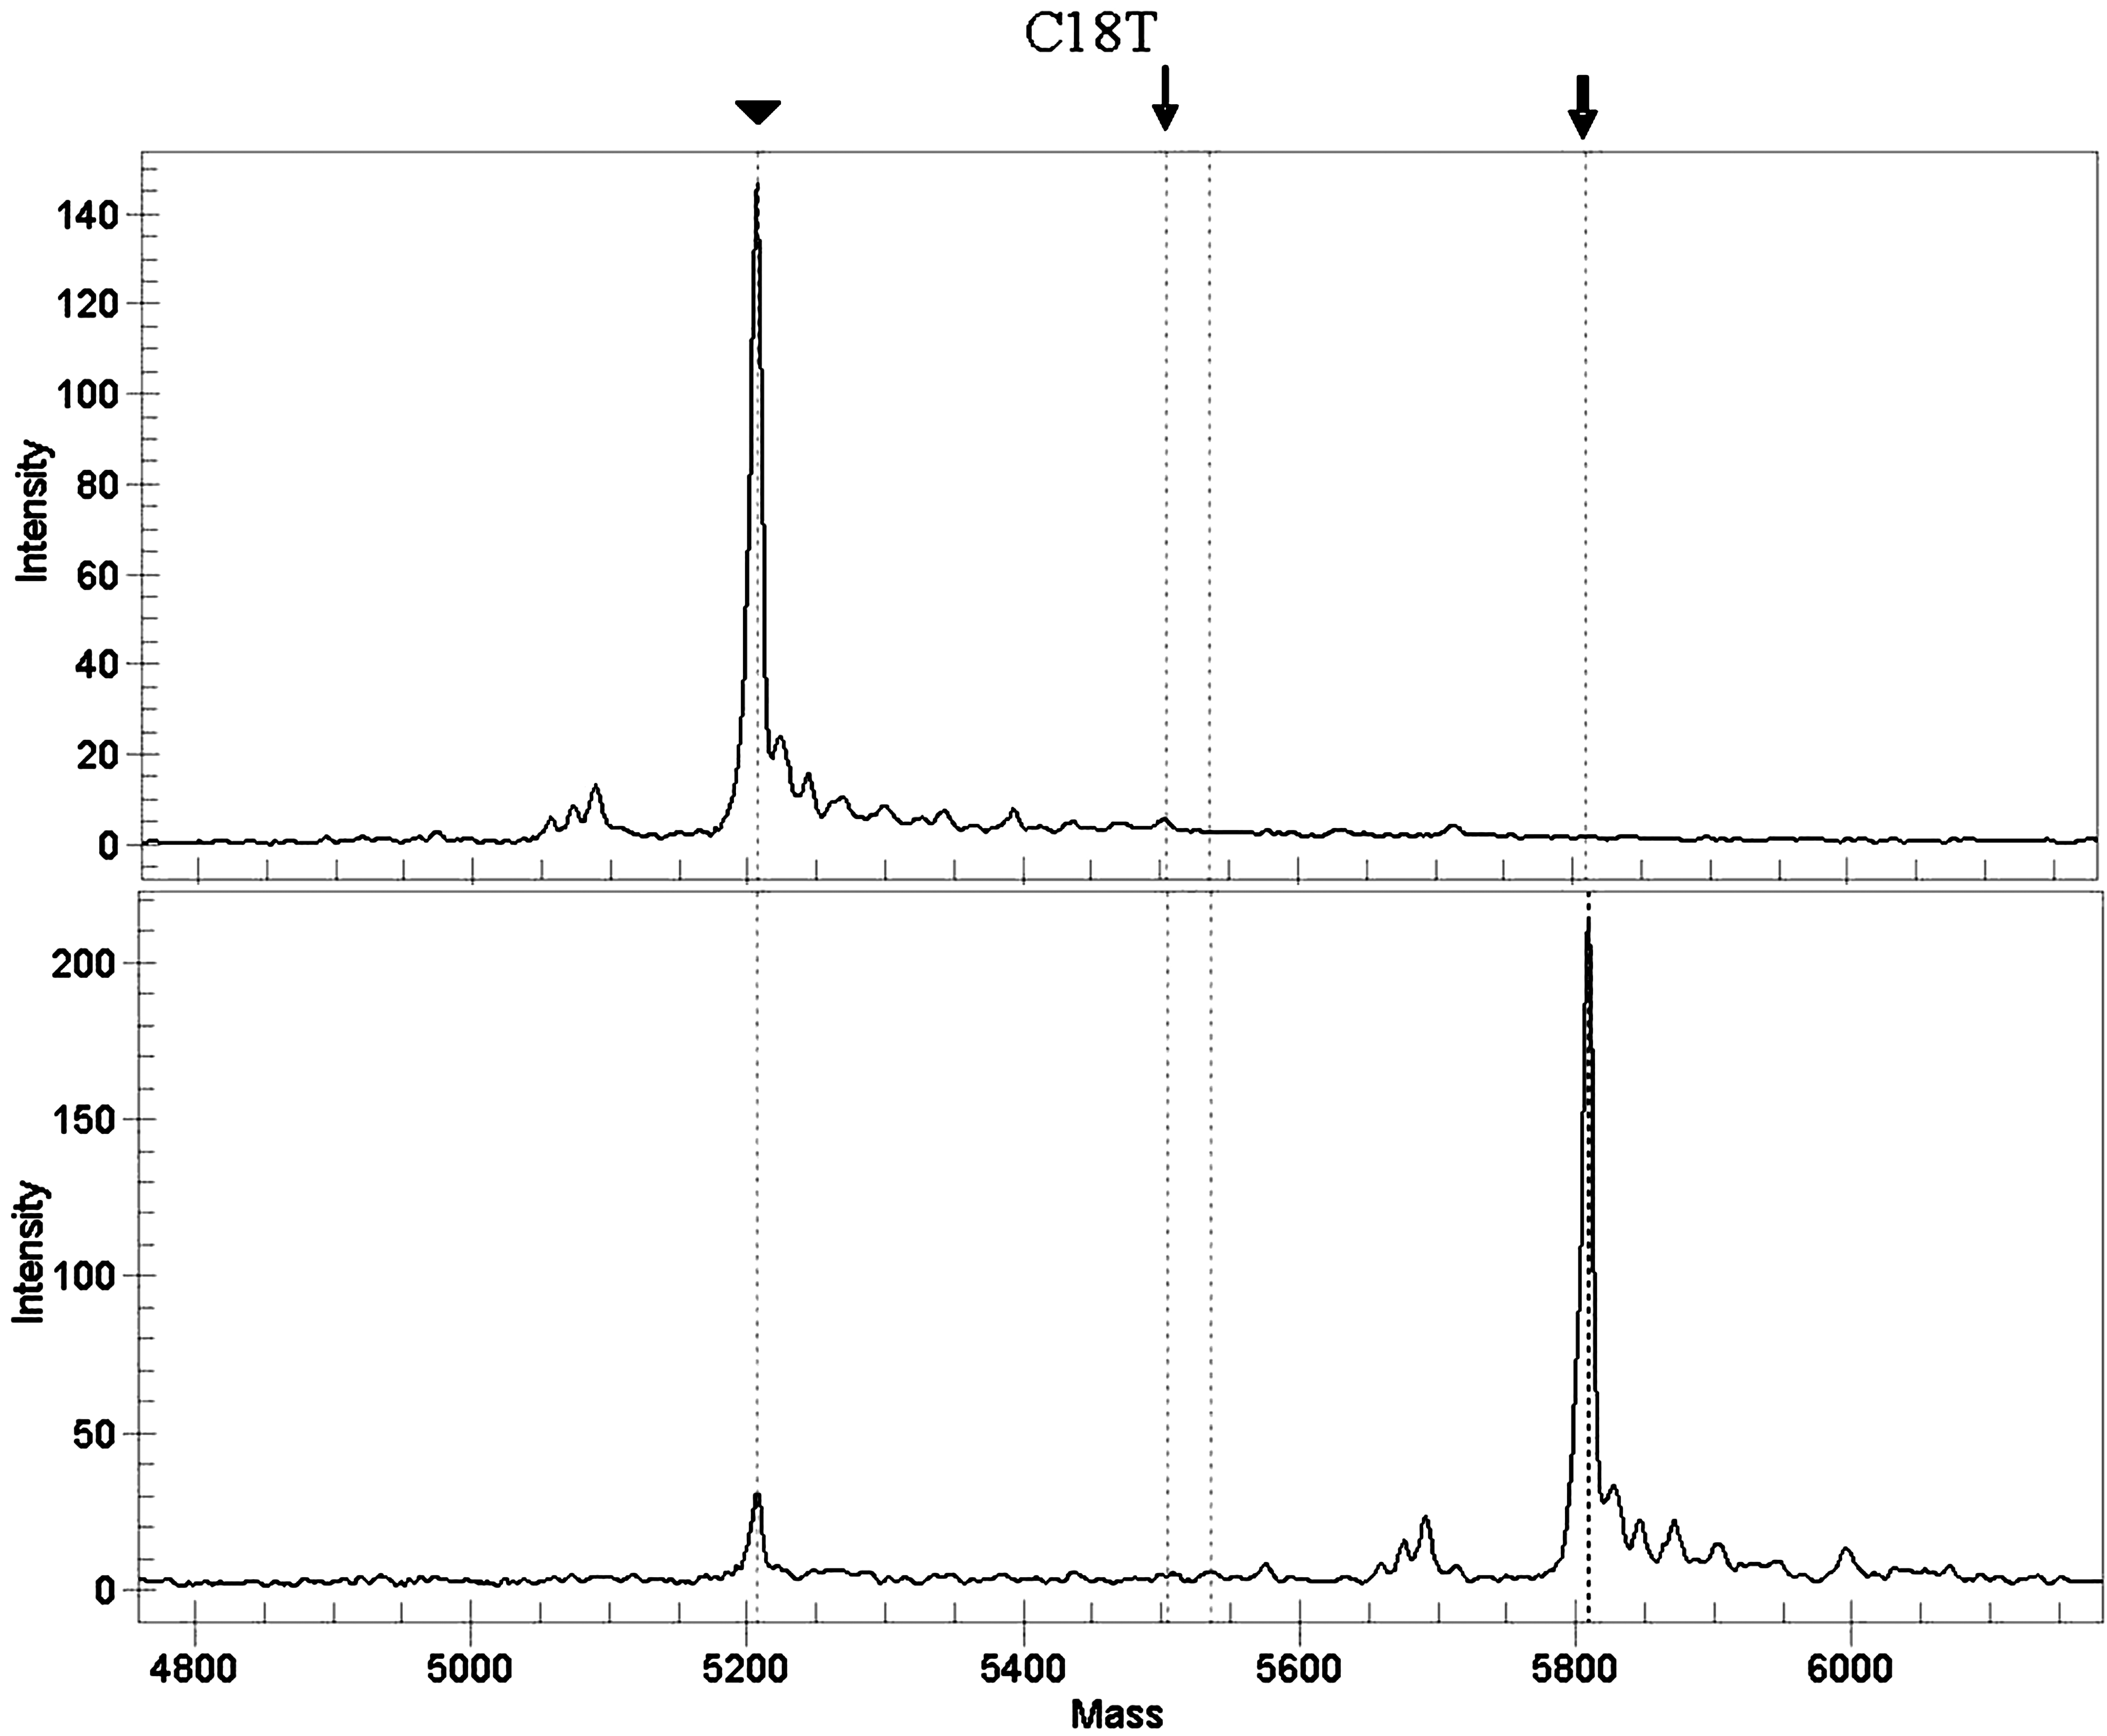
 Figure 1 of Assia, Mol Vis 2010; 16:2487-2493.