Figure 9. Cells demonstrate a decreased level of Nectin-1 receptor expression after primary infection. Monolayers of HCE cells plated
on a 6-well tissue culture dish were treated with a viral dose at an MOI of 0.01 and incubated for 48 h at 37 °C. Cells were
then treated with MTT to distinguish live from dead cells. FACS was then performed to test levels of Nectin-1 on living infected
cells tagged with red fluorescent protein. HCE cells untreated with a viral dose were used as a control and are shown as the
green shade.
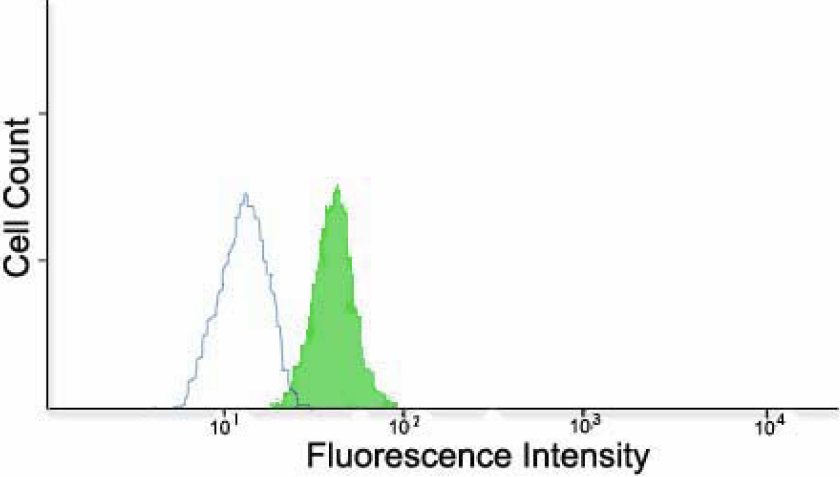
 Figure 9 of
Shah, Mol Vis 2010; 16:2476-2486.
Figure 9 of
Shah, Mol Vis 2010; 16:2476-2486.