Figure 6. Flow cytometry analysis of cell-surface receptor expression. Expression was detected by Fluorescence-activated cell sorter
(FACS) analysis. Cells were treated with primary antibodies to Nectin-1 (A), HVEM (B), or PILR-alpha (C). HCE cells stained only with FITC-conjugated secondary antibody were used as background controls and are shown as the dark
gray in the figure.
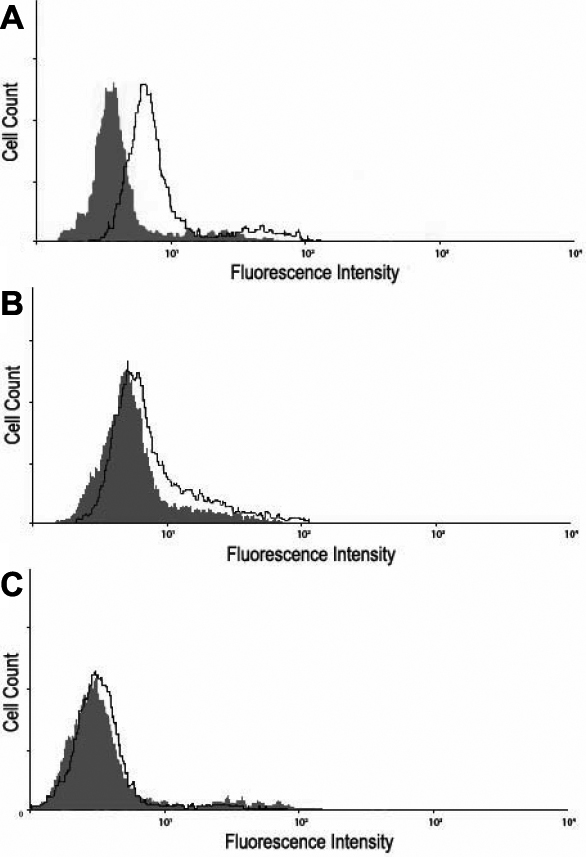
 Figure 6 of
Shah, Mol Vis 2010; 16:2476-2486.
Figure 6 of
Shah, Mol Vis 2010; 16:2476-2486.