Figure 5. Immunofluorescence imaging of receptors on HCE cell membrane. Images shown were taken using the FITC filter of confocal microscope
(Leica SP20). Cells were blocked for 90 min, washed, and then either mock treated with buffer alone (B, D, F) or treated with primary antibodies for Nectin-1 (A), HVEM (C), and PILR-alpha (E). Images were taken after the incubation of HCE cells with FITC-conjugated secondary antibodies. Staining of cells with green
demonstrate receptor expression.
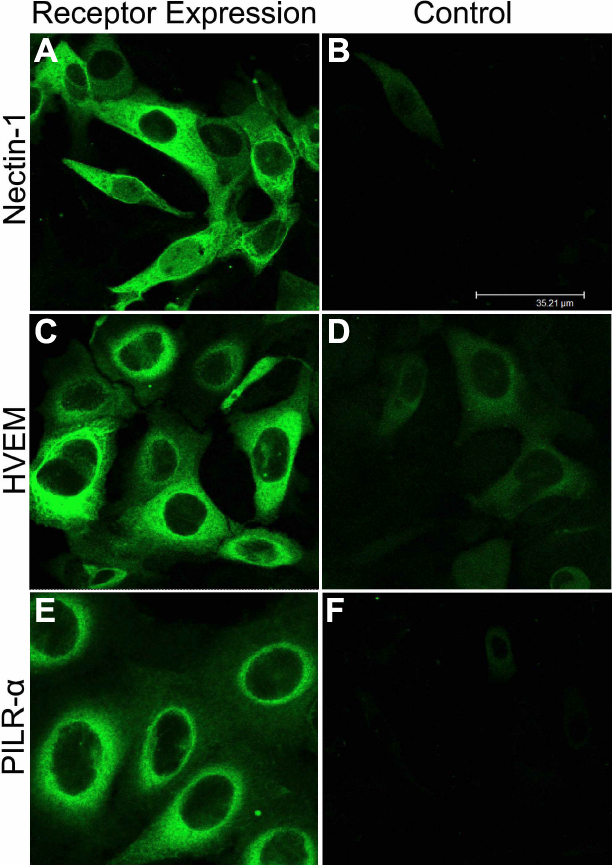
 Figure 5 of
Shah, Mol Vis 2010; 16:2476-2486.
Figure 5 of
Shah, Mol Vis 2010; 16:2476-2486.