Figure 4. Quantitative RT–PCR analysis for entry receptor expression. Total RNA was isolated from HCE and CHO-K1 cells and converted
to cDNA and analyzed by PCR for the receptors as indicated. A house keeping gene, β-actin (ACTB), was used as a control (A). Densitometry analysis was performed using the NIH ImageJ software (Version 1.43) and data for relative intensity was plotted
as a histogram (B).
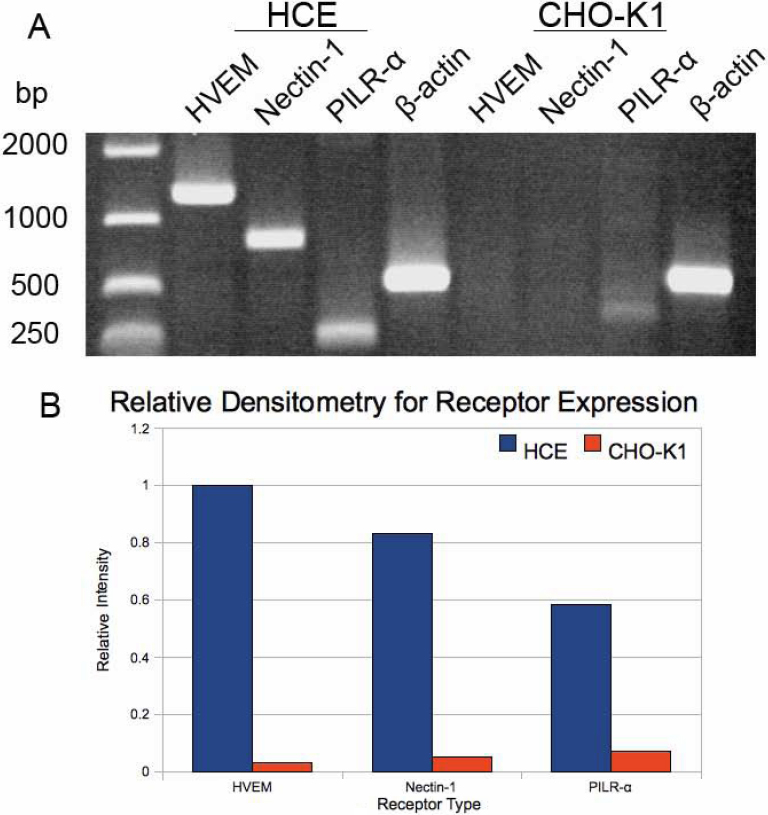
 Figure 4 of
Shah, Mol Vis 2010; 16:2476-2486.
Figure 4 of
Shah, Mol Vis 2010; 16:2476-2486.