Figure 6. Monitoring the thermally-induced amorphous aggregation of MDH by light scattering at 360 nm (solid symbols) and SAXS (open
symbols). In both experiments a 2 mg/ml solution of MDH was incubated at 42 °C in 50 mM phosphate buffer, 100 mM NaCl, 2.5
mM EDTA at pH 7.5 in the absence (squares) or presence (triangles) of αB-crystallin (2.5:1.0 w:w ratio of MDH and αB-crystallin
for the light scattering experiments and a 1.0:1.0 w:w ratio of MDH and αB-crystallin for the SAXS experiments). The change
in light scattering at 360 nm is shown on the left y-axis and the radius of gyration of the samples over time is shown on
the right y-axis. The standard deviations associated with the SAXS data, which represent the standard deviation from the line
of best fit in the Guinier region, are too small to be distinguished in this plot.
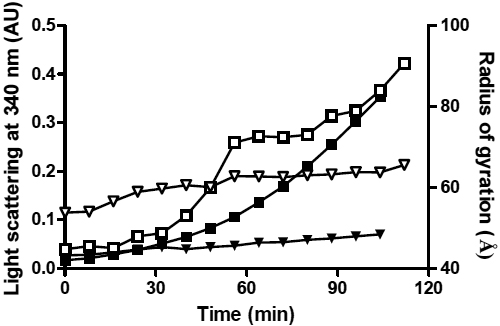
 Figure 6 of
Regini, Mol Vis 2010; 16:2446-2456.
Figure 6 of
Regini, Mol Vis 2010; 16:2446-2456.