Figure 4. The variation in the radius of gyration (Rg) with time after the addition of 20 mM DTT to α-LA (squares), and in the presence of αB-crystallin at a 1:1 (triangles) and
1:10 (diamonds) w:w ratios to α-LA. The standard deviations associated with these data, which represent the standard deviation
from the line of best fit in the Guinier region, are too small to be distinguished in this plot. The Rg values used in deriving ρ (see Discussion) are taken from the final Rg values in this plot.
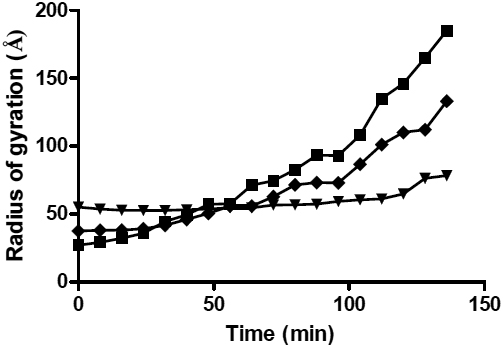
 Figure 4 of
Regini, Mol Vis 2010; 16:2446-2456.
Figure 4 of
Regini, Mol Vis 2010; 16:2446-2456.