Figure 3 of
Regini, Mol Vis 2010; 16:2446-2456.
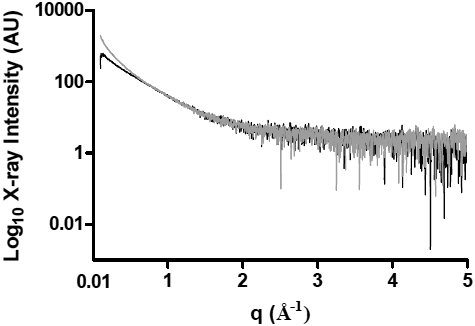
Figure 3.
The X-ray intensity profiles plotted against the inverse space (
q
) of α-LA at 37 °C, 32 min (black) and 72 min (gray) after the addition of DTT.
 Figure 3 of
Regini, Mol Vis 2010; 16:2446-2456.
Figure 3 of
Regini, Mol Vis 2010; 16:2446-2456.