Figure 4. Real-time RT–PCR for macrophage migration inhibitory factor, interleukin-1β, and tumor necrosis factor-α in the ocular surface
and lacrimal gland after chemical burn (at days 2, 7, and 30 after injury). A-C: Ocular surface; panels D-F: lacrimal gland. A: MIF expression. MIF is elevated in the ocular surface after chemical burn induction on days 2, 7, and 30 relative to the
controls. P values: day 0 versus day 2 (p<0.001), day 0 versus day 7 (p=0.003), day 0 versus day 30 (p=<0.001), otherwise
not significant. B: The expression of IL-1β. IL-1β evidenced dramatic changes in the ocular surface after chemical burn induction. P values:
day 0 versus day 2 (p<0.001), day 0 versus day 2 (p=0.001), day 0 versus day 3 (p=0.002), otherwise not significant. C: TNF-α expression. TNF-α is elevated in the ocular surface after chemical burn. P values: day 0 versus day 2 (p=0.009), day
0 versus day 7 (p=0.032), day 0 versus day 30 (p=0.049), otherwise not significant. D: The expression of MIF. E: The expression of IL-1β. F: The expression of TNF-α. Both MIF and IL-1β evidenced no significant changes in the lacrimal gland after chemical burn.
However, TNF-α is elevated in the lacrimal gland after chemical burn. P values: day 0 versus day 2 (p=0.001), day 2 versus
day 7 (p=0.020), otherwise not significant. Error bars show mean±1.0 standard error; bars show means.
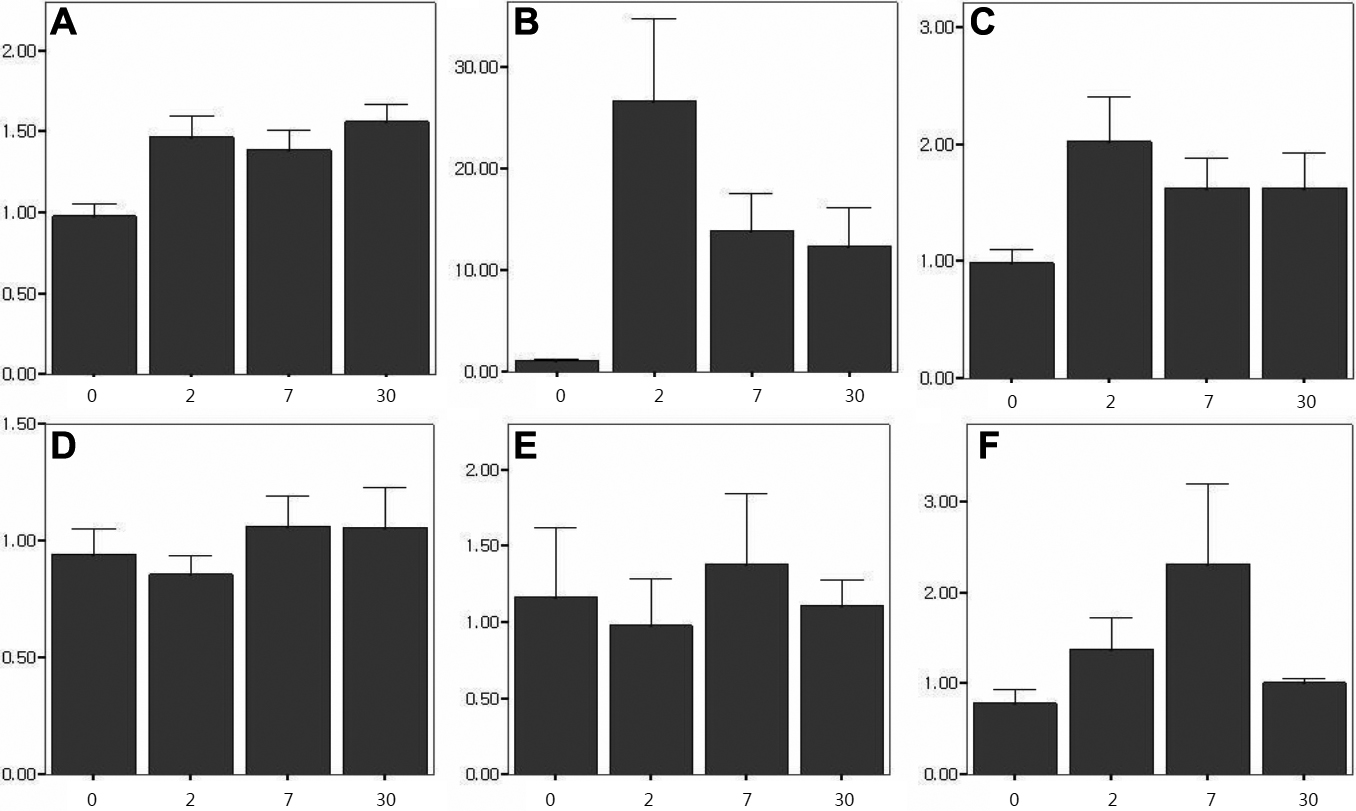
 Figure 4 of
Oh, Mol Vis 2010; 16:2402-2411.
Figure 4 of
Oh, Mol Vis 2010; 16:2402-2411.