Figure 5. Measurement of blood–retinal barrier breakdown by Evans blue. A: Bar graph show standard curve for Evans blue concentration in formamide (background-subtracted absorbance at 620–740 nm;
concentration from 1 to 80 μg/ml). B: Histogram shows retinal Evans blue leakage in diabetic rats at different times. *Values of treatment were compared to that
of normal control * p value <0.05, ** p value<0.01. Values of treatment were compared to that of paired control # p value
<0.05, ## p value<0.01
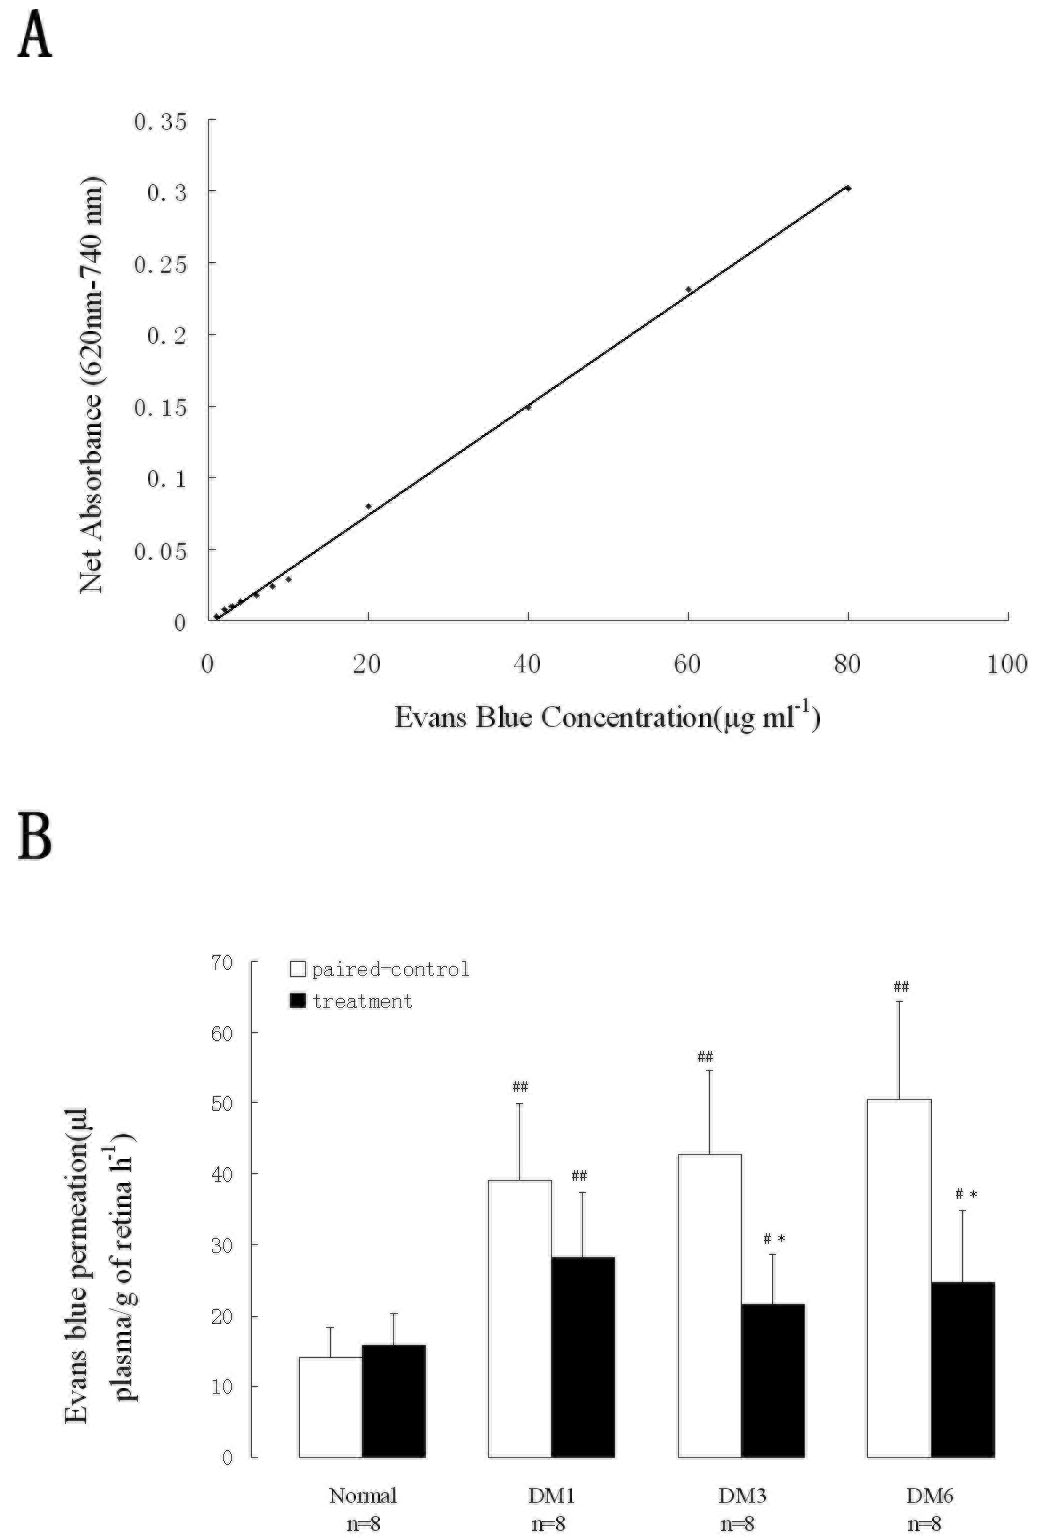
 Figure 5 of
Yu, Mol Vis 2010; 16:2384-2394.
Figure 5 of
Yu, Mol Vis 2010; 16:2384-2394.