Figure 3. Expression of vascular
endothelial growth factor in retinae after intravitreous injection. A:
Vascular
endothelial growth factor (VEGF) mRNA in paired control
retinae increased with time to almost twice that in the normal control
eyes after 6 months. Similarly, the amount of VEGF mRNA in the
retinae of all treatment groups was statistically higher than the
amount in normal retinae but was significantly lower than the amount in
the respective paired control eyes (p<0.01). B: The
expression of VEGF protein in treated retinae paralleled the expression
of VEGF mRNA. Values of treatment were compared to that of
normal control * p value <0.05, ** p value<0.01. Values of
treatment were compared to that of paired control # p value <0.01.
Abbreviations: DM1 represents diabetes 1 month, DM3 represents diabetes
3 months, DM6 represents diabetes 6 months, CON represents normal
control group, CONf represents sham-injected normal control group, t
represents treatment.
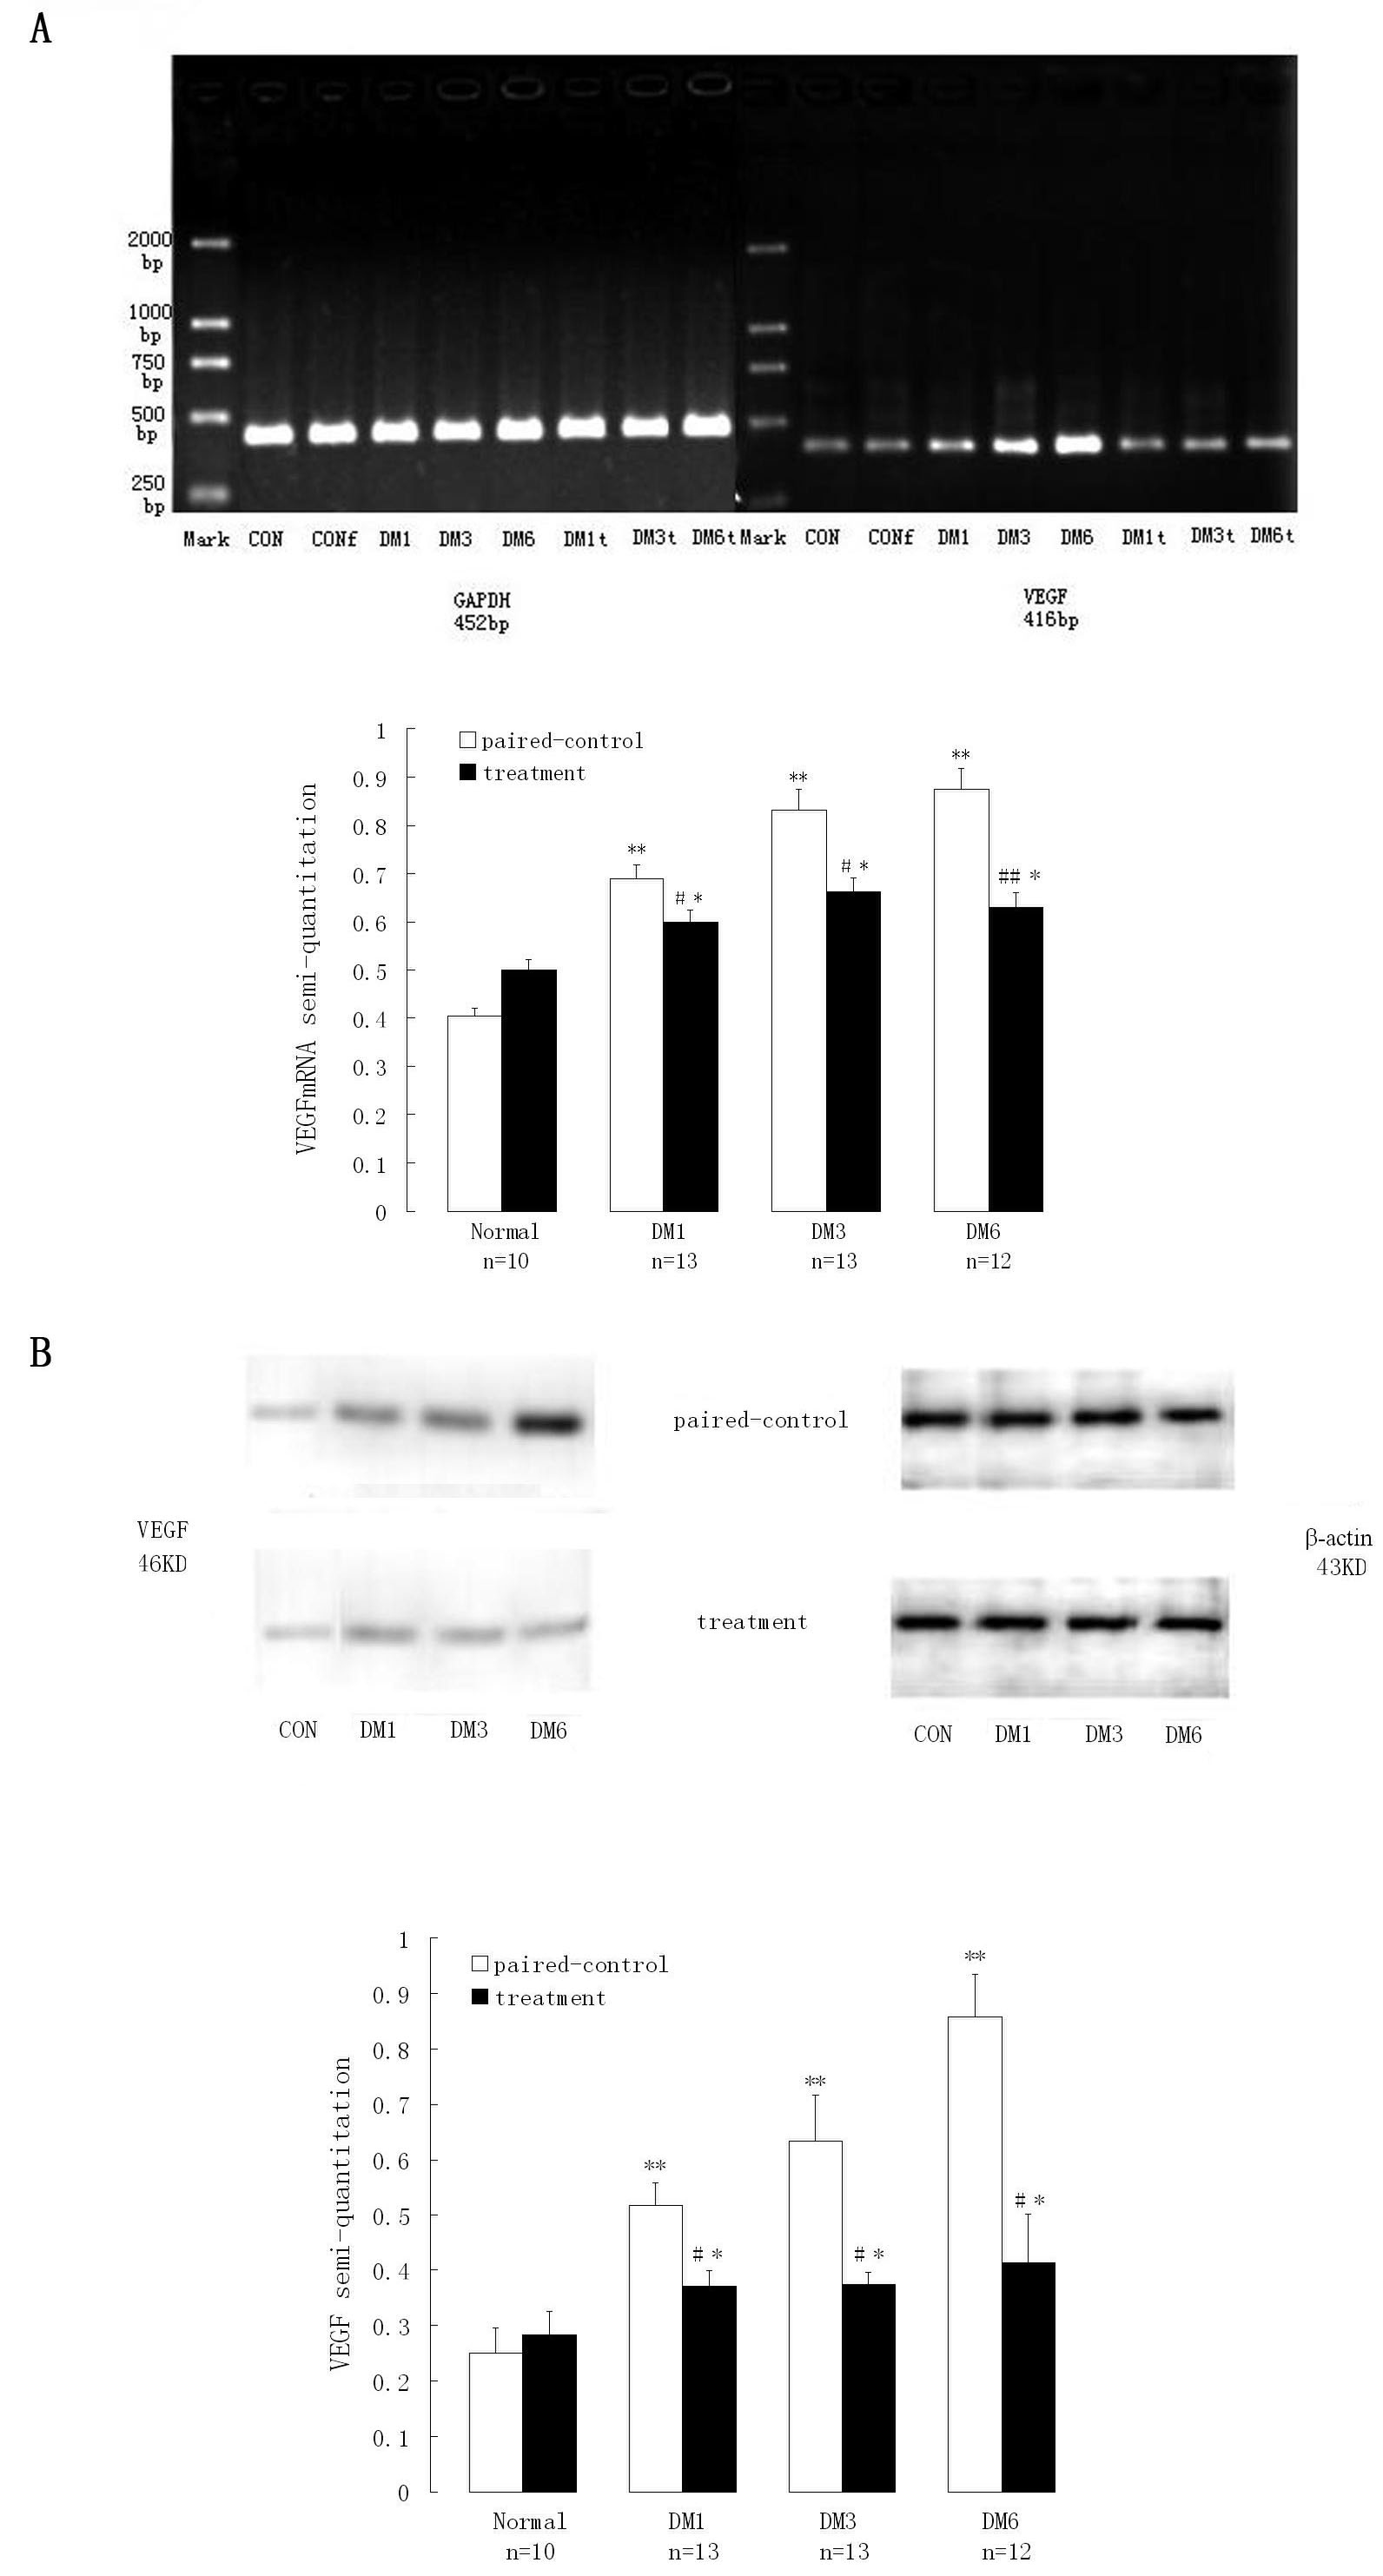
 Figure 3 of Yu, Mol Vis 2010; 16:2384-2394.