Figure 5. Immune infiltration and
corresponding clinical picture (group R). A, B: Group
R: Rate of immune cells infiltrating the graft at the time of rejection
(A; n=6). At this time point, the graft is completely opaque (B).
C, D: Group R: Significant reduction in infiltrating
immune cells one year after surgery (C; n=6; *p<0.001). Graft
clarity is restored (D). A and C: Boxplots.
Arrows in B and D mark sutures indicating the graft
border.
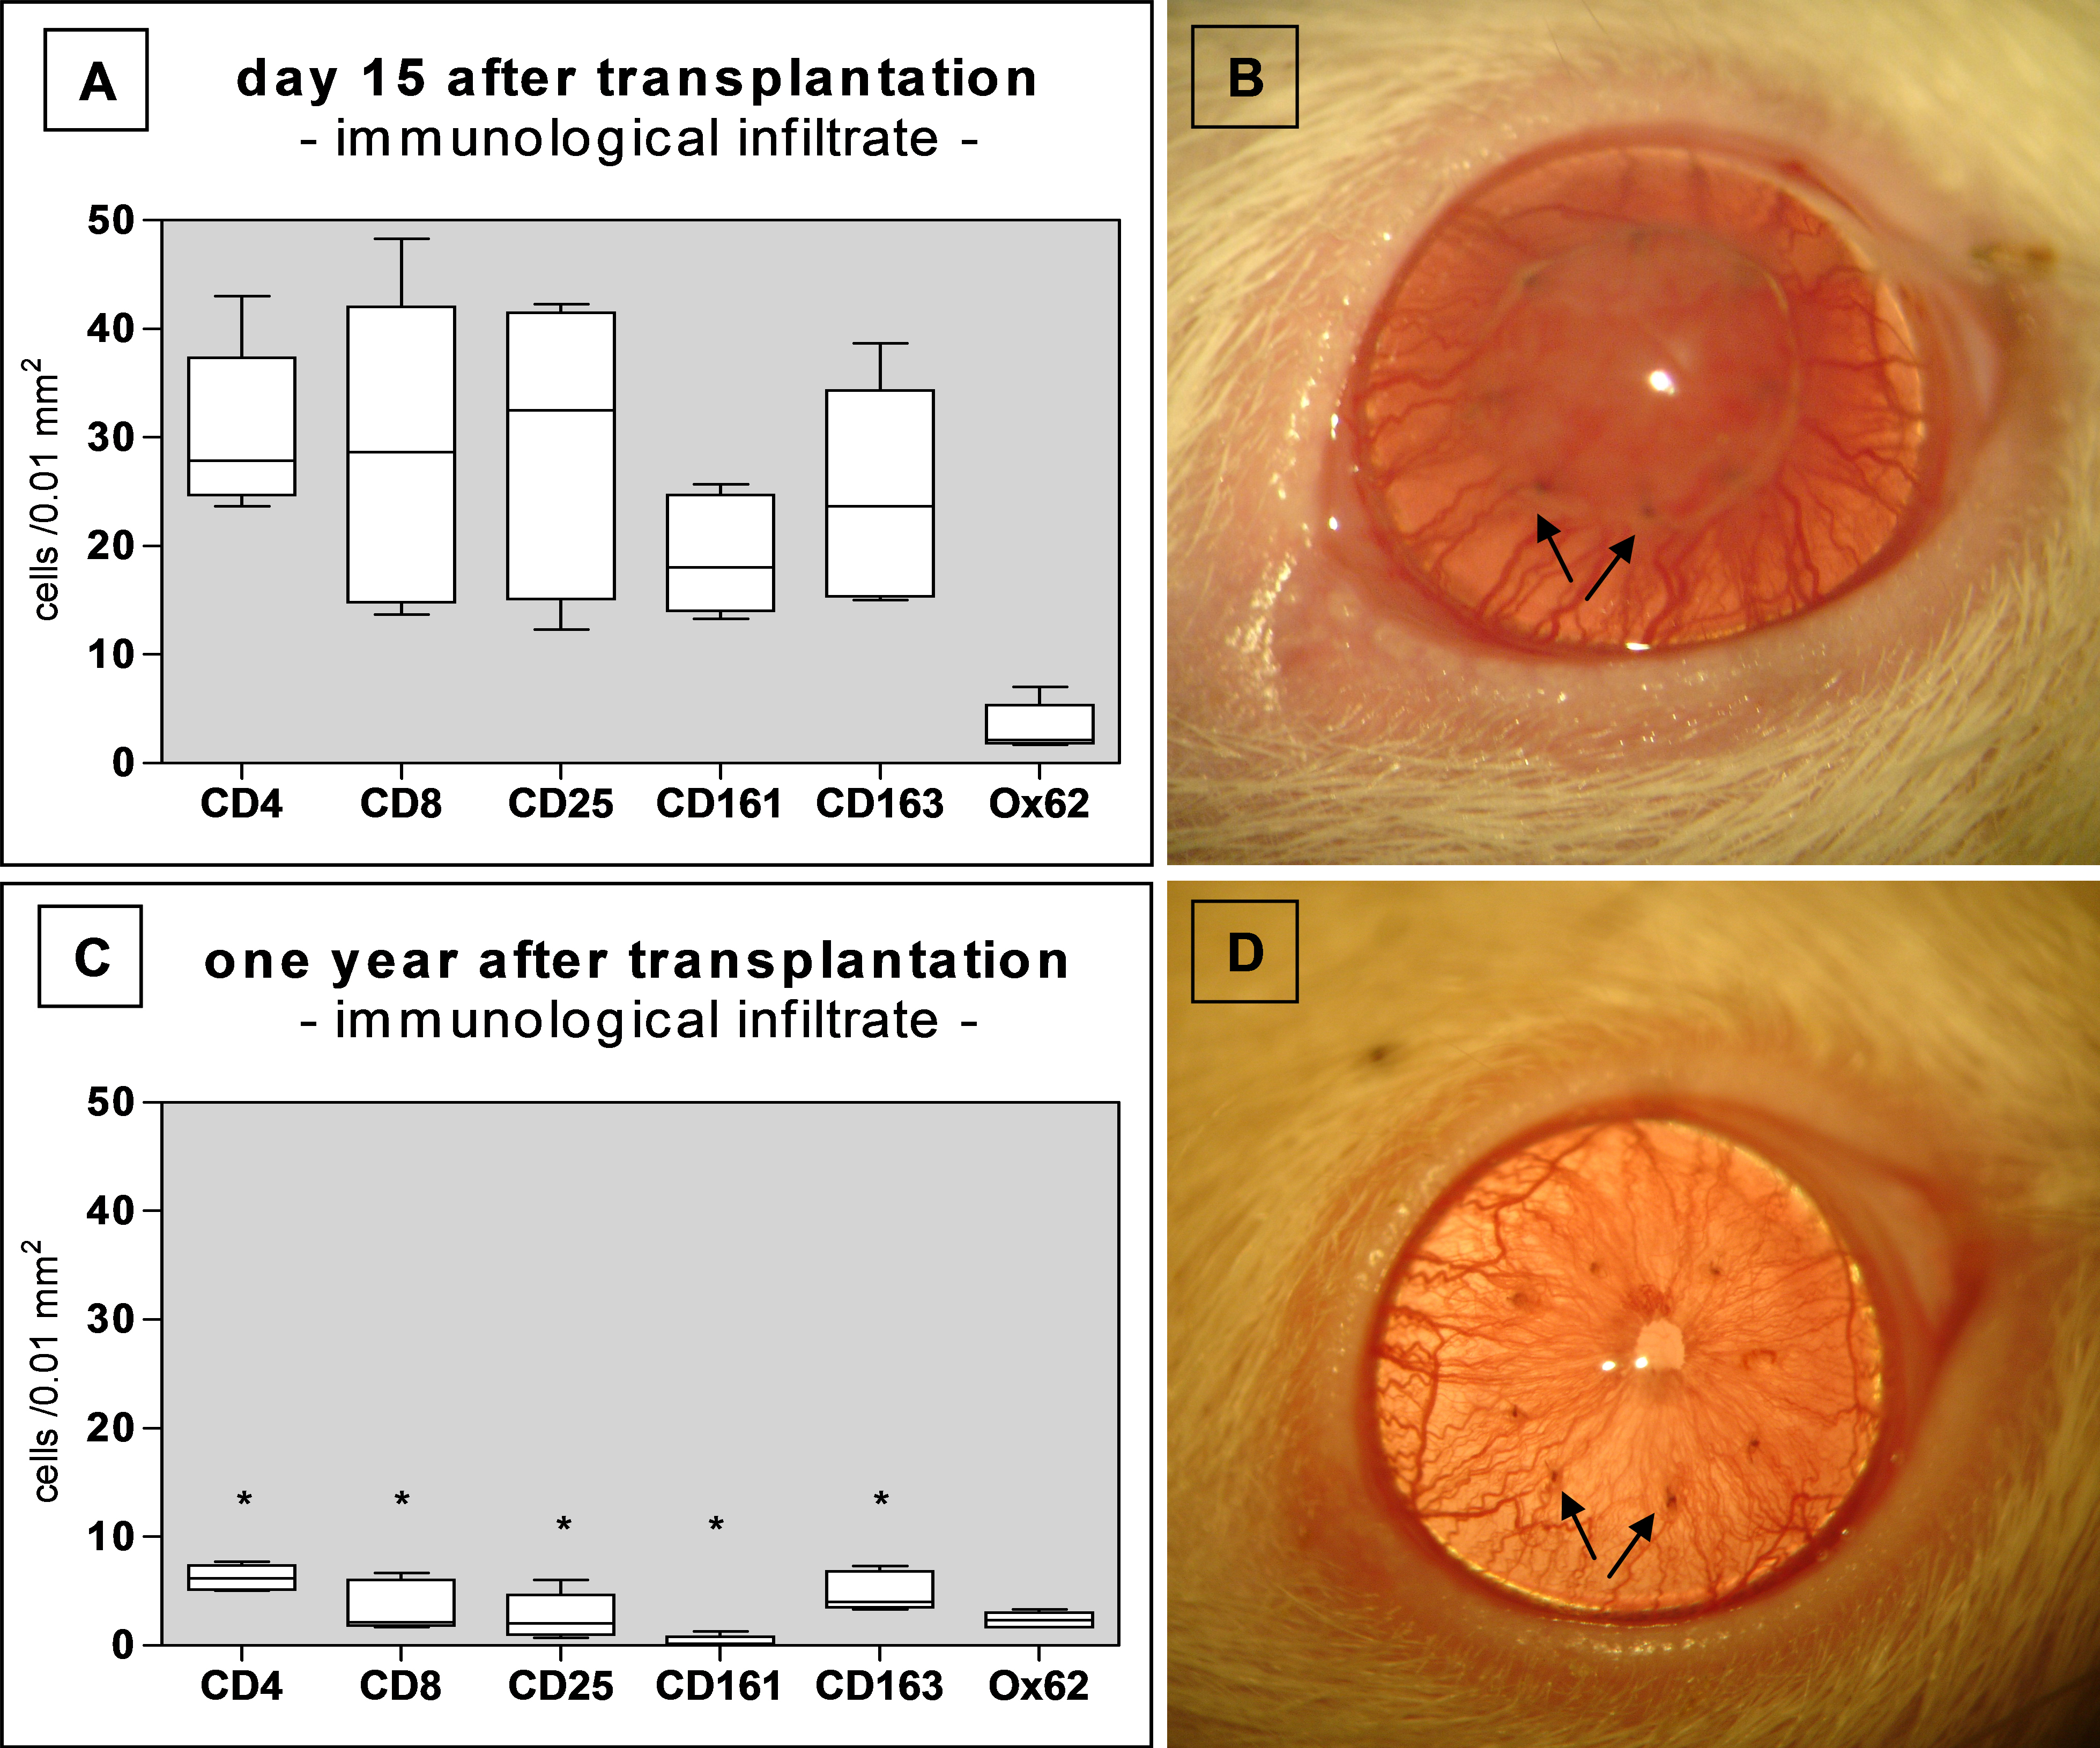
 Figure 5 of Schwartzkopff, Mol Vis 2010; 16:2368-2375.