Figure 1. Endothelial cell loss on
rejected corneal allografts. A: Kaplan–Meier survival analysis:
100% rejection rate of allografts (group R), no rejections for
syngeneic controls with endothelium (control group) or following
mechanical endothelial removal before syngeneic transplantation (group
S). B, C: Group R: Endothelium at the time of rejection
(day 15 after surgery). B: Staining with Alicarin red S. C:
Same
cut, DAPI staining of cell nuclei. Superior; Intact host
endothelium; Inferior: Graft with endothelium destroyed following
immune reaction. Arrow: Suture in the underlying stroma, indicating the
graft border. D, E: Control group: Endothelium of
untreated syngeneic controls at the corresponding time point. Superior:
Intact host endothelium; Inferior: Intact graft endothelium. Arrow:
Suture in the underlying stroma, indicating the graft border.
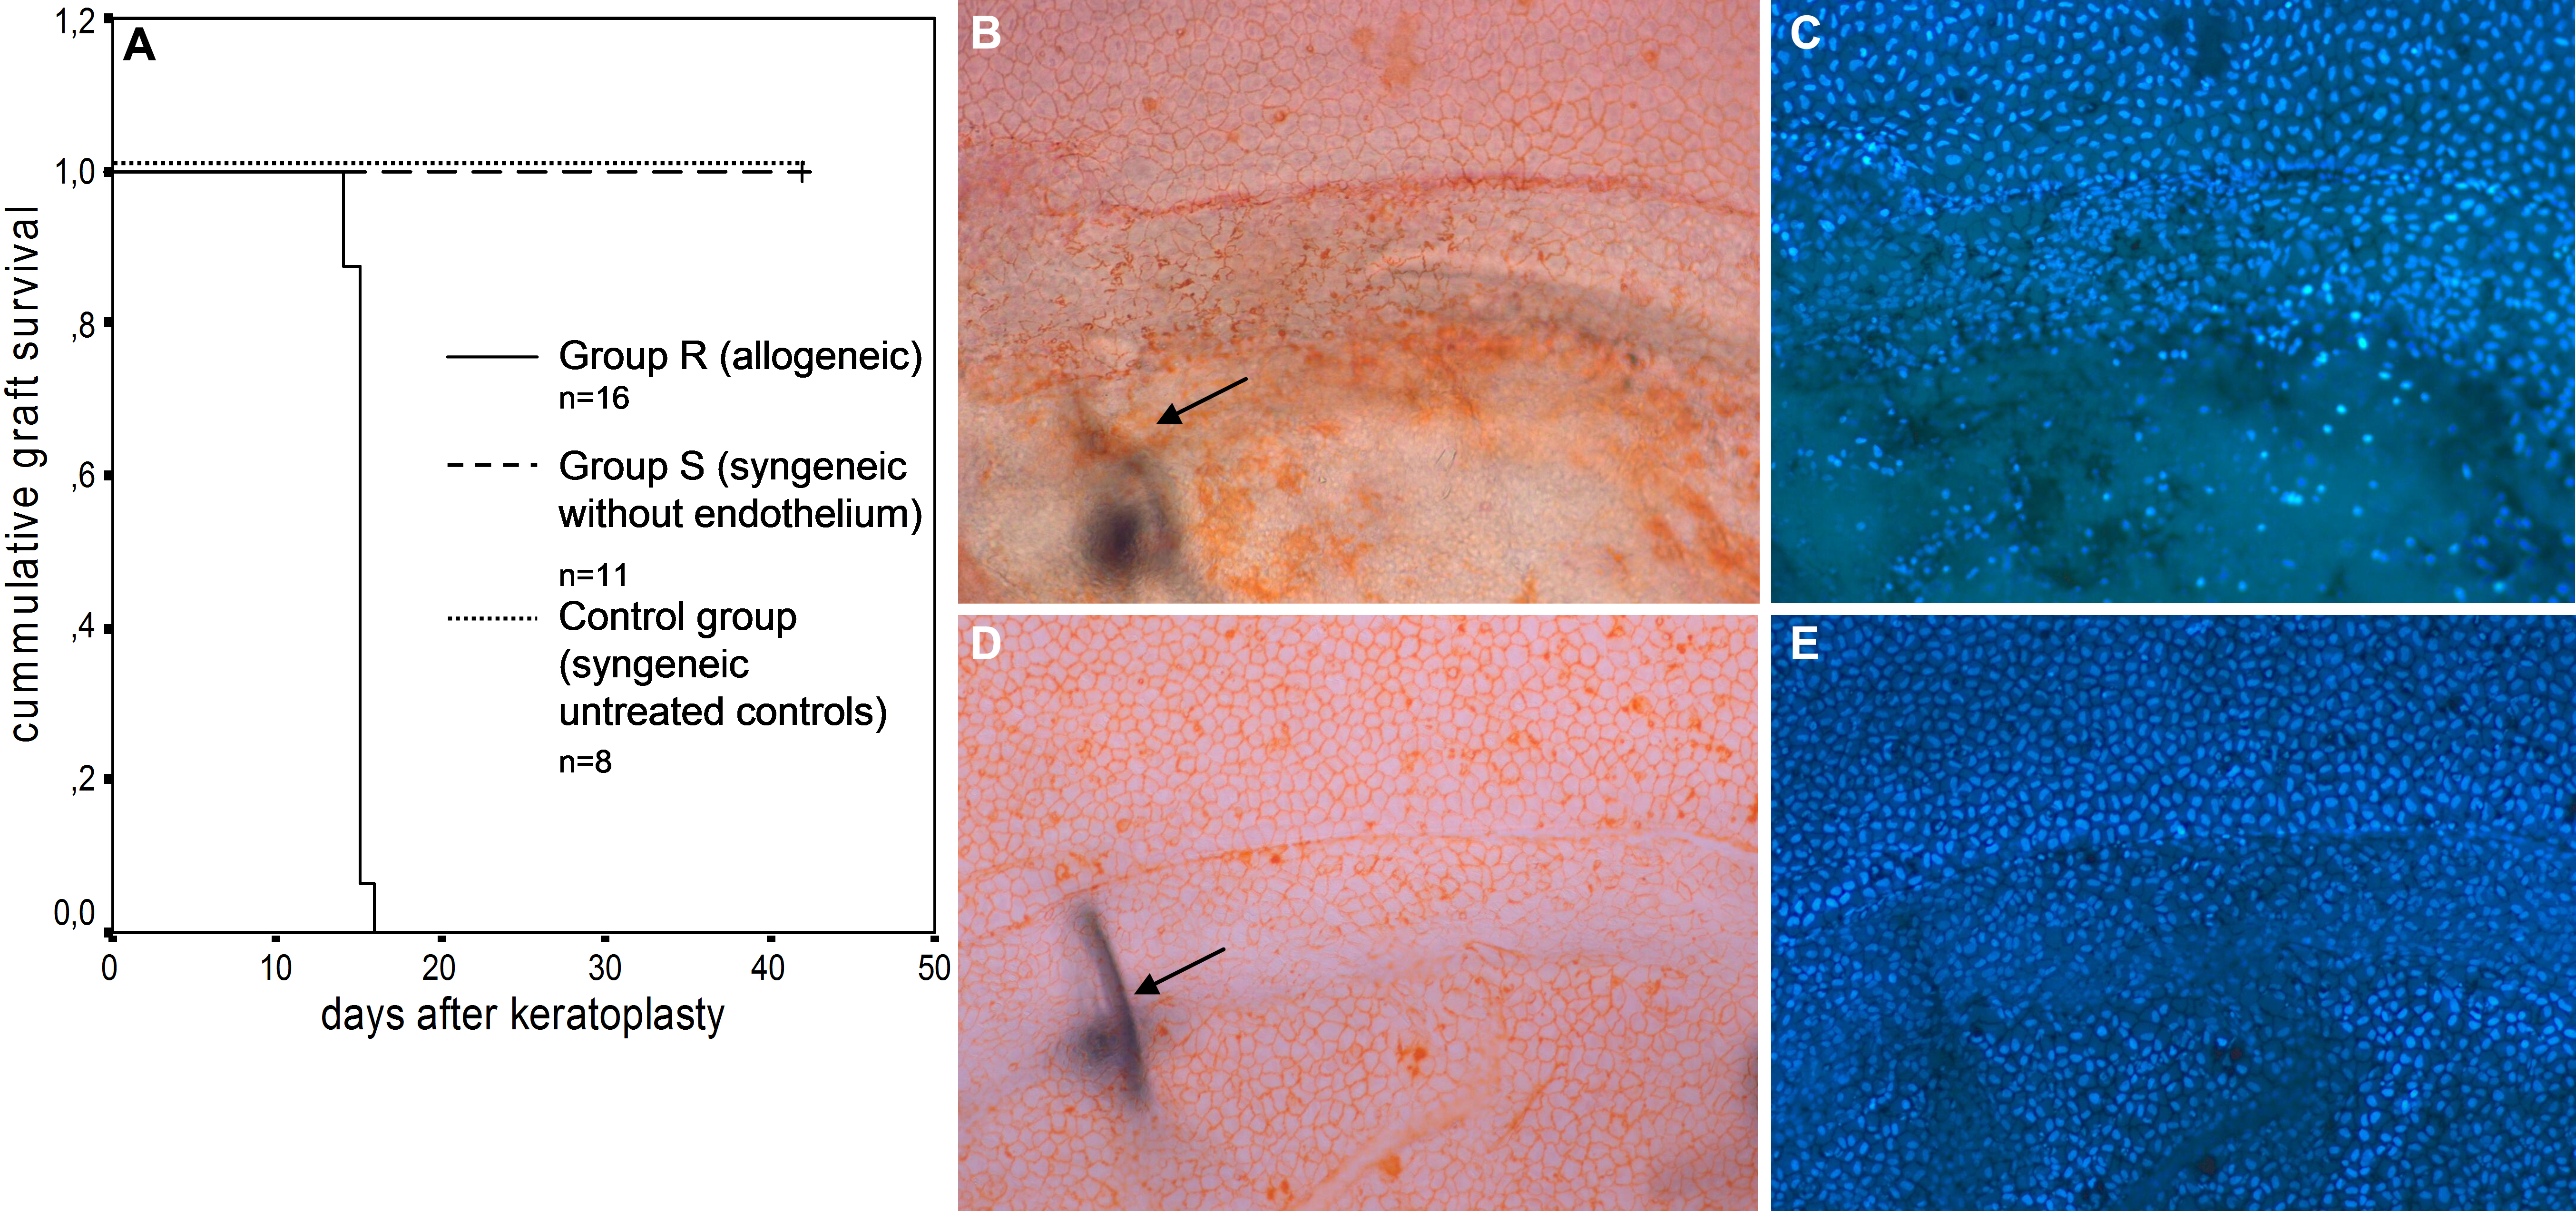
 Figure 1 of Schwartzkopff, Mol Vis 2010; 16:2368-2375.