Figure 1. Kaplan–Meier estimations of
rejection free survival for the 975 patients in cohort 2. The HLA-class
I matched (less or equal 10 mismatched HLAMatchmaker eplets) and
non-matched (>10 mismatched HLAMatchmaker eplets) sub-groups are
displayed separately. More immune reactions occur when tolerance factor
higher than 220 eplets2 (light gray) in comparison to
keratoplasties
with the tolerance factor lower or equal than 220 eplets2
(dark gray).
This difference seems to be even more pronounced in the non-HLA-class I
matched subgroup.
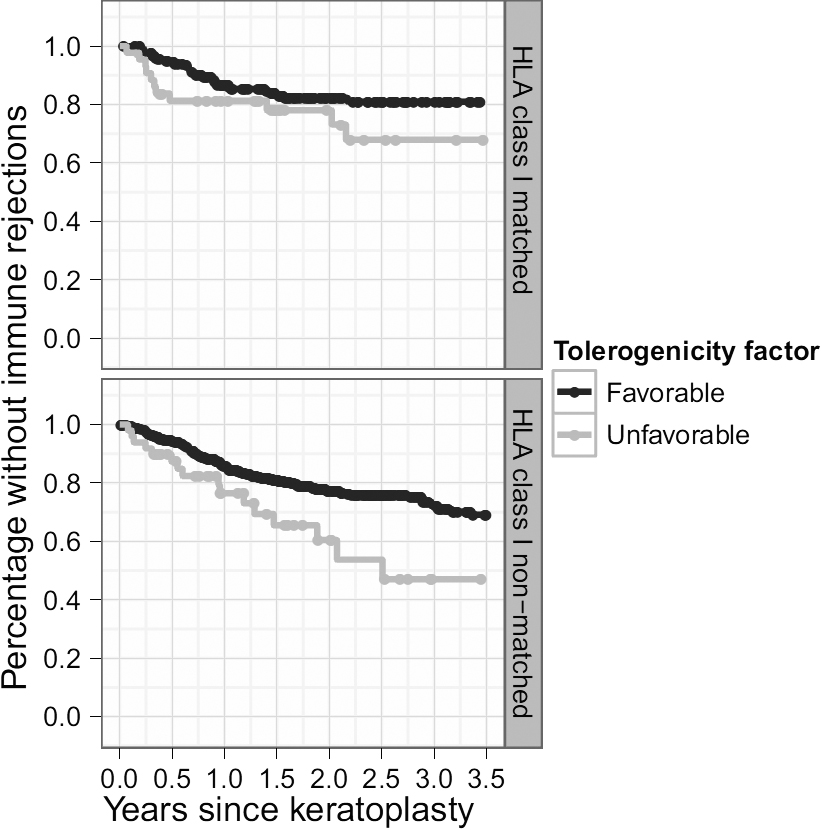
 Figure 1 of Böhringer, Mol Vis 2010; 16:2362-2367.