Figure 3. Partial DNA sequence of CRYBA3/A1 from one normal and one affected individual, showing a heterozygous mutation (IVS3+1 G>A) in the third canonical GT site
of CRYBA3/A1 (black triangles). The black vertical line denotes the normal exon 3-intron 3 donor splice site.
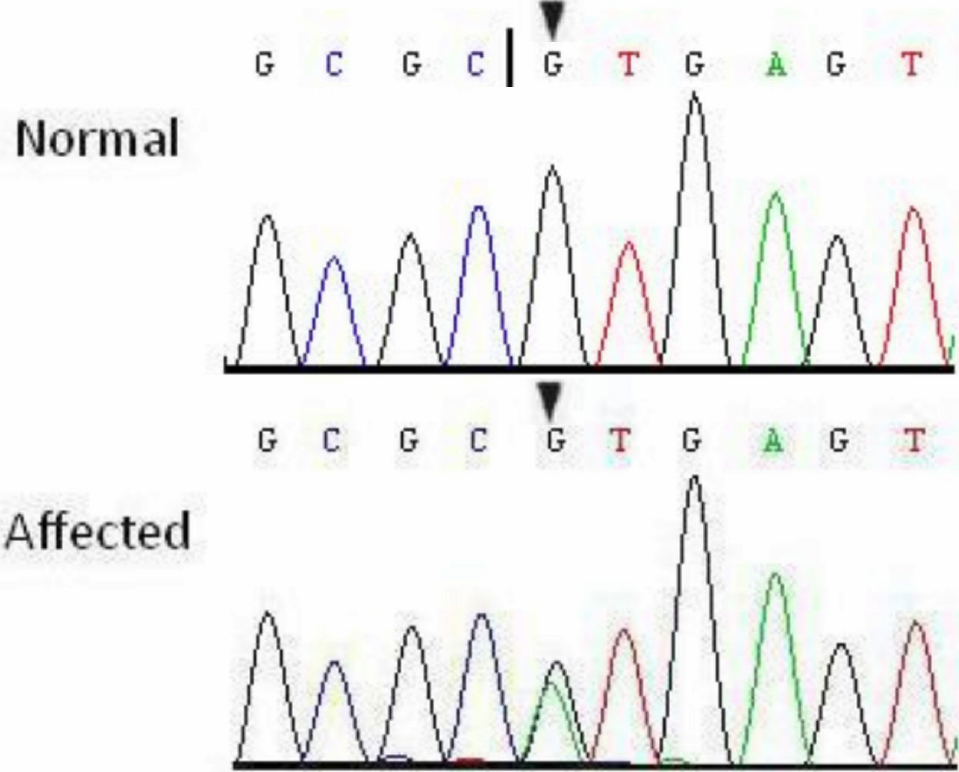
 Figure 3 of
Zhu, Mol Vis 2010; 16:2347-2353.
Figure 3 of
Zhu, Mol Vis 2010; 16:2347-2353.