Figure 6. Tumor necrosis factor (TNF)-R1 and TNF-R2 mRNA expression. A-B: TNF-R1 and (C-D) TNFR2 mRNA expression levels in (A, C) the neuroretina and (B, D) retinal blood vessels from sham-operated eyes were compared to eyes subjected to ischemia followed by 5 h (n=7) and 12 h
(n=8) of reperfusion (I-R), assessed by real-time PCR. The mRNA levels were calculated relative to the housekeeping gene Actb. Results are expressed as the number of times by which the TNFR1 and TNF-R2 mRNA increased in the neuroretina from ischemia-reperfusion eyes compared with the sham-operated eyes (mean±SEM). Statistical
analysis was performed using paired Student ratio t-test with the Bonferroni correction.
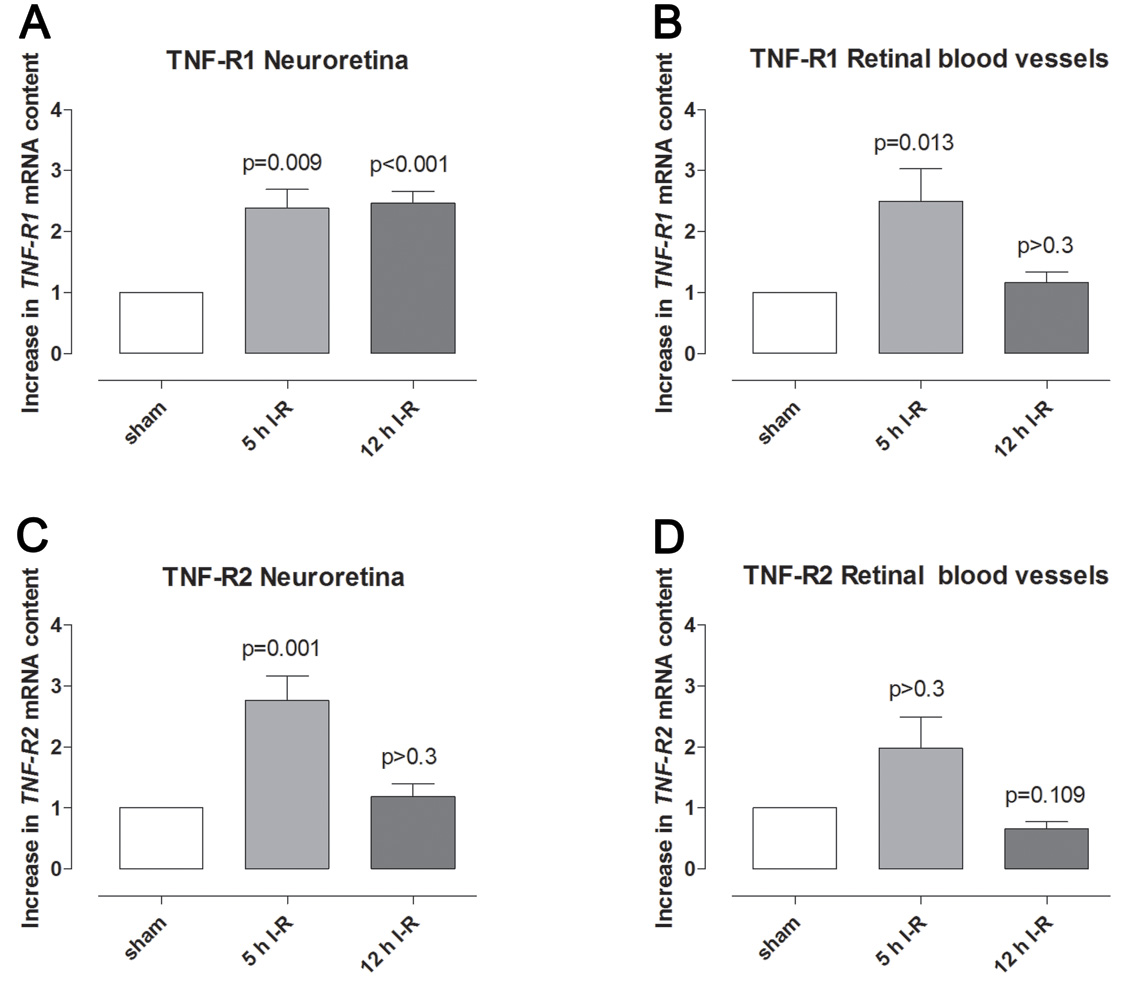
 Figure 6 of
Gesslein, Mol Vis 2010; 16:2317-2327.
Figure 6 of
Gesslein, Mol Vis 2010; 16:2317-2327.