Figure 3. Tumor necrosis factor α in the vitreous. Extracts of vitreous were incubated with an angiogenesis antibody array membrane
and tumor necrocsis factor α (TNF-α) protein levels in the vitreous in eyes exposed to 12 h of ischemia-reperfusion (n=6),
were compared to sham-operated eyes (n=6). The graph shows the mean values±standard error of the mean obtained from quantification
of the spot intensity and is expressed as the number of times by which the TNF-α increased in ischemia-reperfusion compared
with the sham-operated eyes. Statistical analysis was performed using paired Student ratio t test. Note that TNF-α protein levels in the vitreous humor are higher following ischemia-reperfusion.
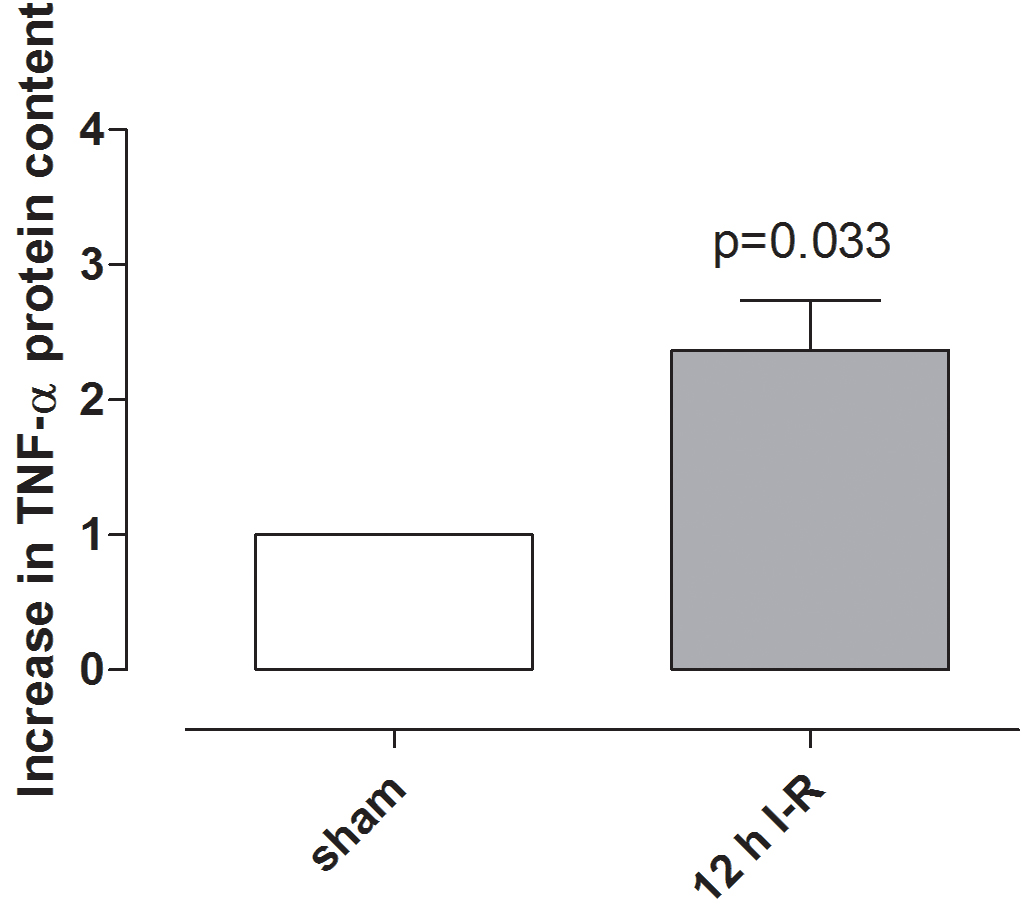
 Figure 3 of
Gesslein, Mol Vis 2010; 16:2317-2327.
Figure 3 of
Gesslein, Mol Vis 2010; 16:2317-2327.