Figure 2. Fundus images during fluorescein
angiography of a retina that is exposed to high intraocular pressure
(80 mmHg). A: At 80 mmHg blood flow was completely
obstructed. The intraocular pressure (IOP) was then gradually reduced
and the following events were observed: (B) hyperfluorescence of
the optic nerve head and filling of the large blood vessel of the
choroidal circulation; (C) distinct pulsations and slight
filling of the retinal arteries (at this stage, medium-sized choroidal
vessels, but not choriocapillaries, were perfused); (D) blood
flow through the arteries was then restored, but still no venous
filling; (E) micro-emboli were seen to move slowly out of the
veins to allow reperfusion; (F) and finally, background
fluorescence after angiography.
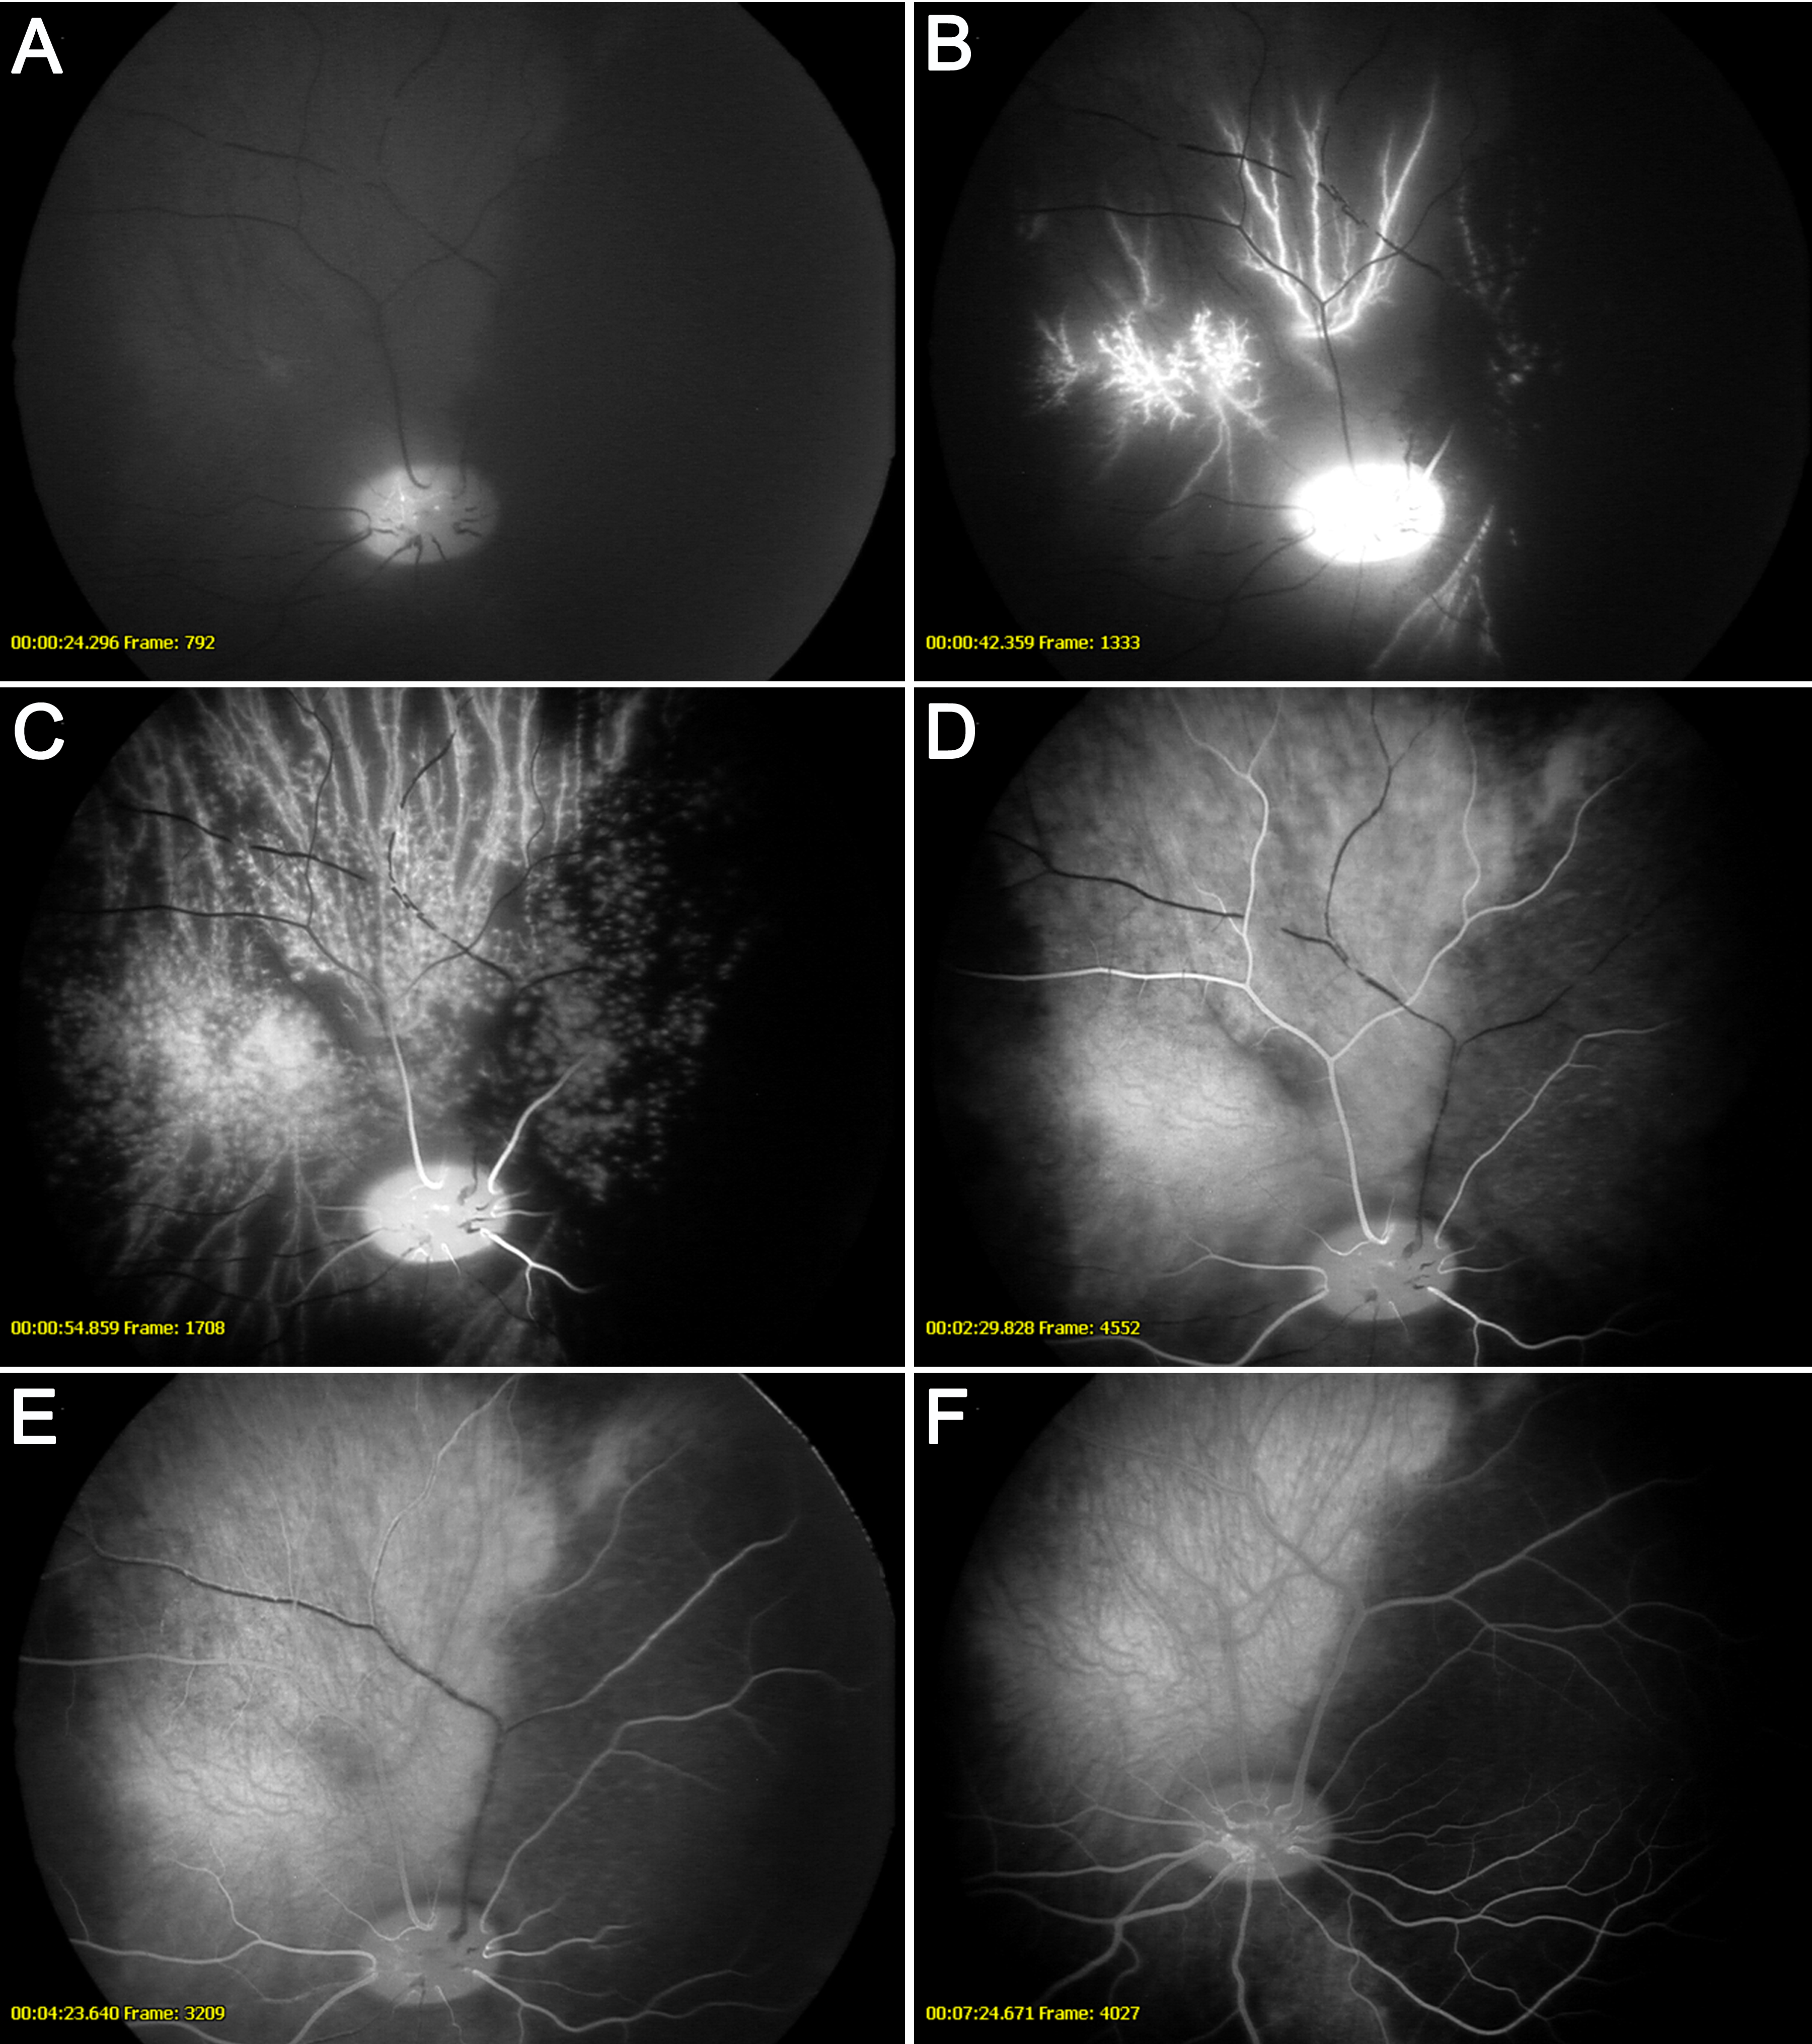
 Figure 2 of Gesslein, Mol Vis 2010; 16:2317-2327.