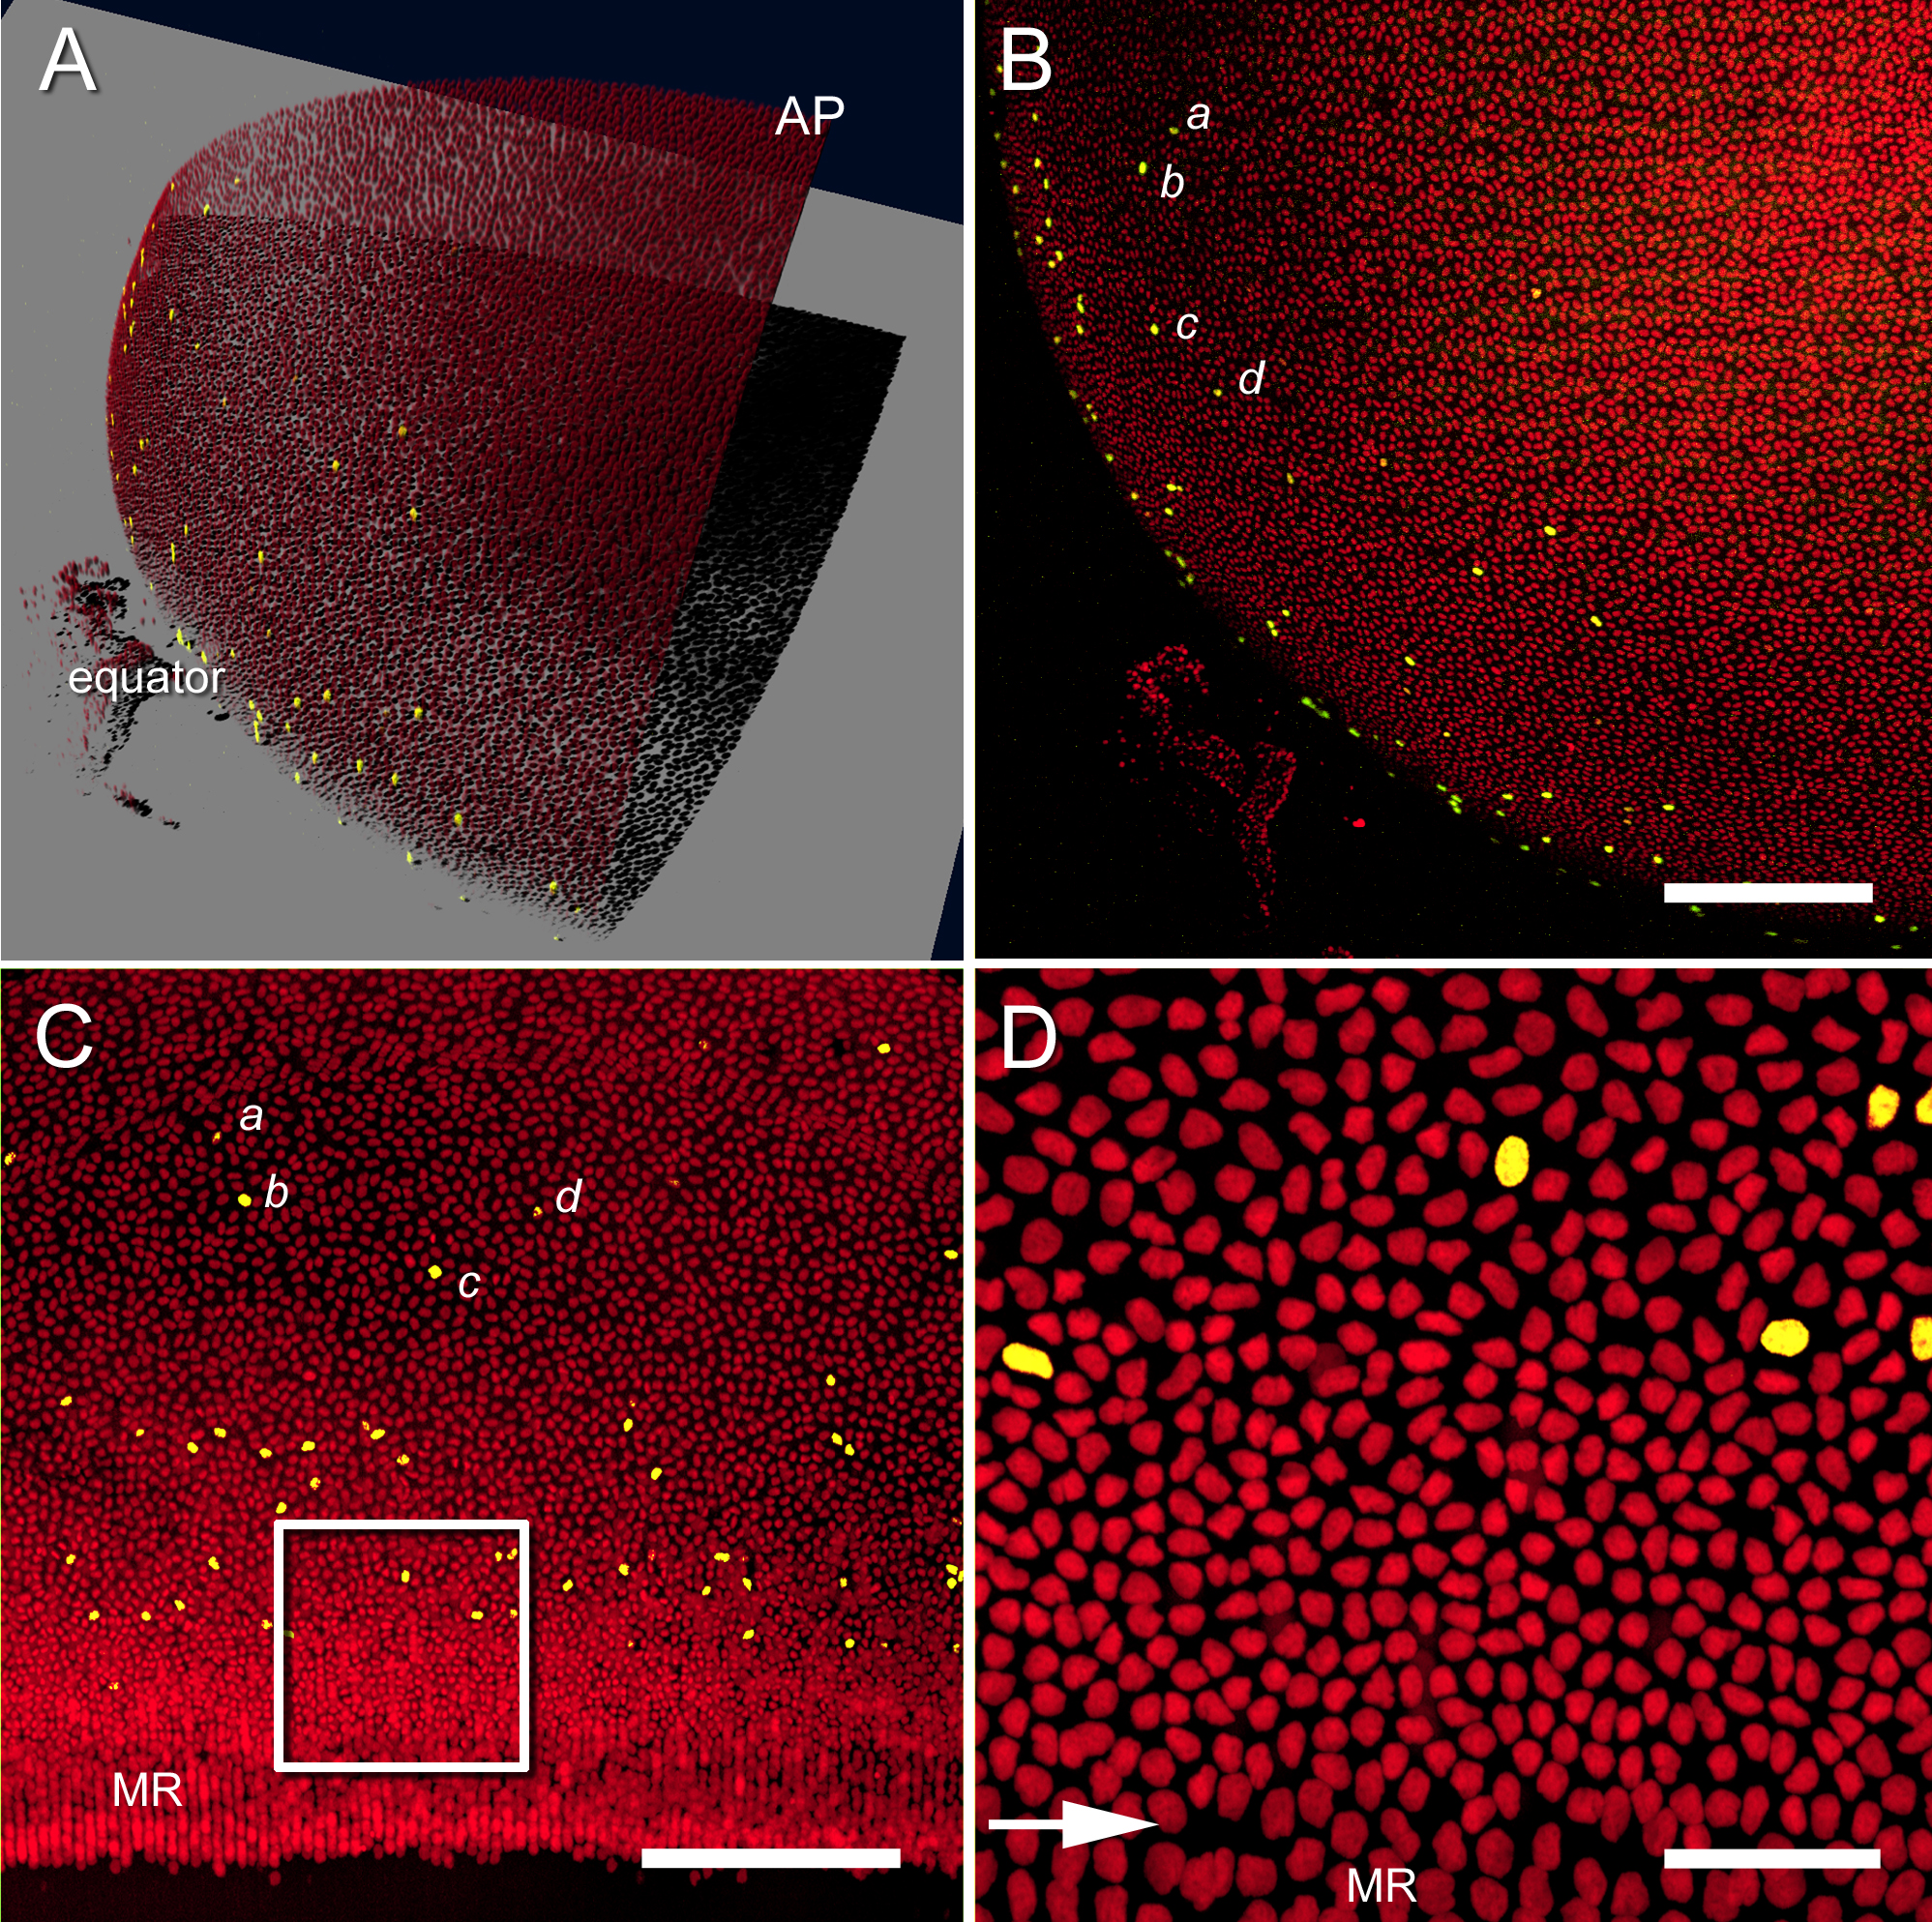
Figure 3. Orthographic projections of
anterior or equatorial regions of the mouse lens.
A:
Three-dimensional rendering of an anterior lens quadrant, showing
EdU-positive nuclei (yellow) and total draq5-stained nuclei (red). An
animated version of this panel can be viewed at
animation1.
EdU-positive cells are
relatively numerous near the lens equator but rare or absent in the
anterior polar (AP) region.
B: Two-dimensional orthographic
projection of the data shown in
A. The EdU-positive cells form
recognizable “constellations.” One such constellation is formed by four
nuclei: a, b, c, d.
C: Two-dimensional orthographic projection
of the lens equator. The constellation a, b, c, d, is also discernible
in this orientation.
D: High magnification view of the boxed
region shown in
C. A change in the size and orientation of the
fiber cell nuclei (arrow) indicates that fiber cell differentiation has
commenced and that cells have entered the meridional rows (MR). Scale
bars in
B and
C are 250 µm, and in
D is 50 µm.
 Figure 3 of Bassnett, Mol Vis 2010; 16:2294-2300.