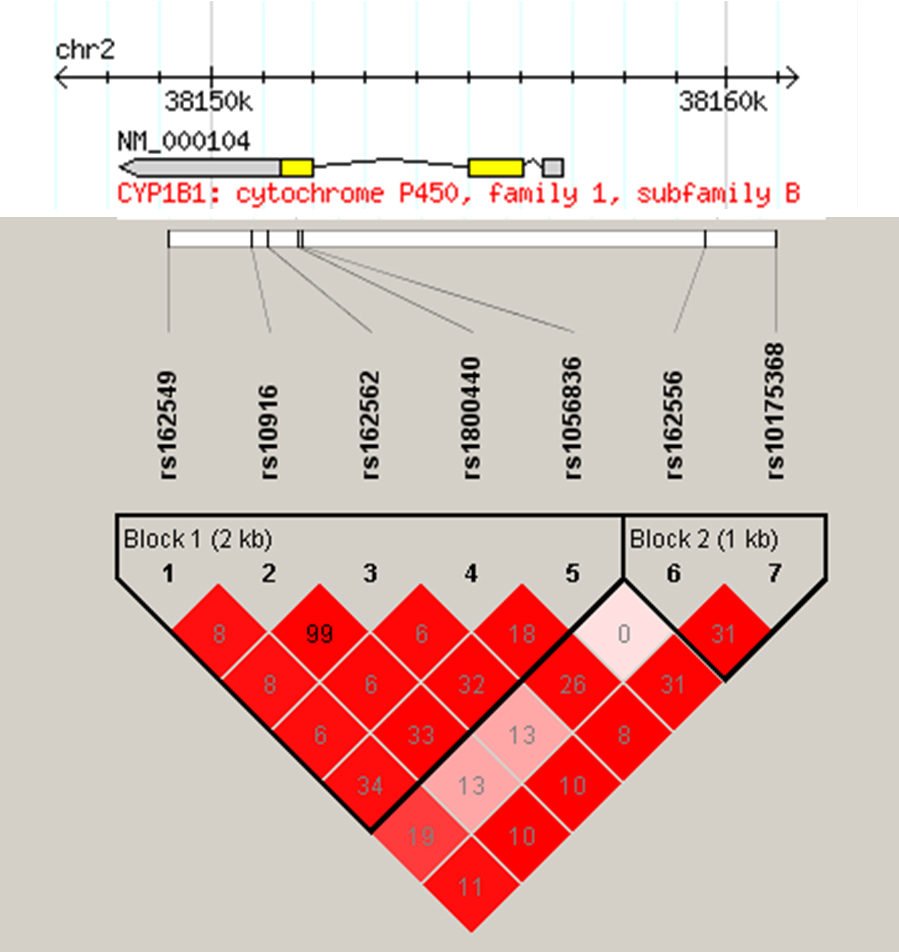
Figure 1. Linkage disequilibrium pattern between tag SNPs typed in the
CYP1B1 gene. R
2 values are given in the intersecting boxes, with darker colors indicating stronger linkage disequilibrium. The position of
each SNP relative to the gene is indicated. Figure generated in Haploview [
19].
 Figure 1 of
Burdon, Mol Vis 2010; 16:2286-2293.
Figure 1 of
Burdon, Mol Vis 2010; 16:2286-2293.