Figure 2. Linkage disequilibrium (LD) plot
of six single nucleotide polymorphisms (SNPs) on complement factor D (CFD).
The physical position of each SNP is shown above the plot. Darker
shades of red indicate higher values of the LD coefficient (D'). The
numbers in pink and white squares show the % of D' between SNPs with
incomplete LD. Blue squares with no number indicate a pairwise linkage
disequilibrium of 1 between SNPs, supported by logarithm (base 10) of
odds (lod) scores < 2.
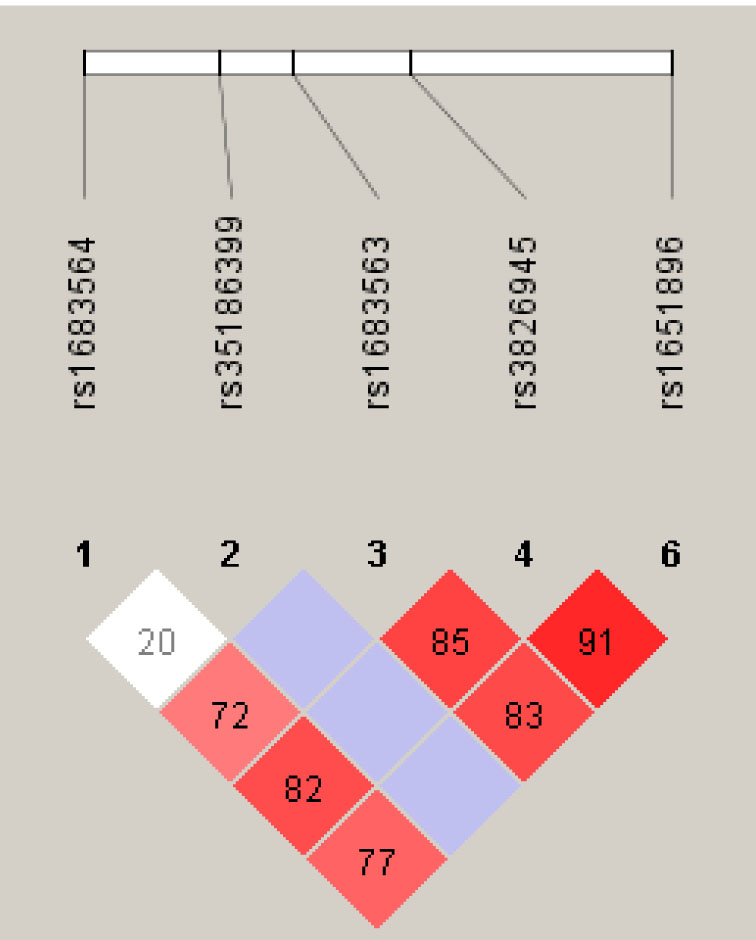
 Figure 2 of Zeng, Mol Vis 2010; 16:2273-2278.