Figure 7. Photomicrograph of representative siRNA transfected hTCEpi cultures. This figure shows photomicrographs of representative
siRNA transfected hTCEpi cell cultures: (A) non-wounded; (B) wounded at 0 h post-wounding; (C), (D), and (E) are siRNAPMCA4 transfected cell cultures at 6 h, 21 h, and 30 h post-wounding, respectively; (F), (G), and (H) are siRNAScrambled transfected cell cultures for the corresponding respective time intervals. At 21 and 30 h post-wounding are siRNAPMCA4 CE cells fail to close the denuded (i.e., wounded) area as compared to siRNAScrambled transfected cells where the wound is closed at 21 h. Bar in H represents 100 µm and applies to all panels.
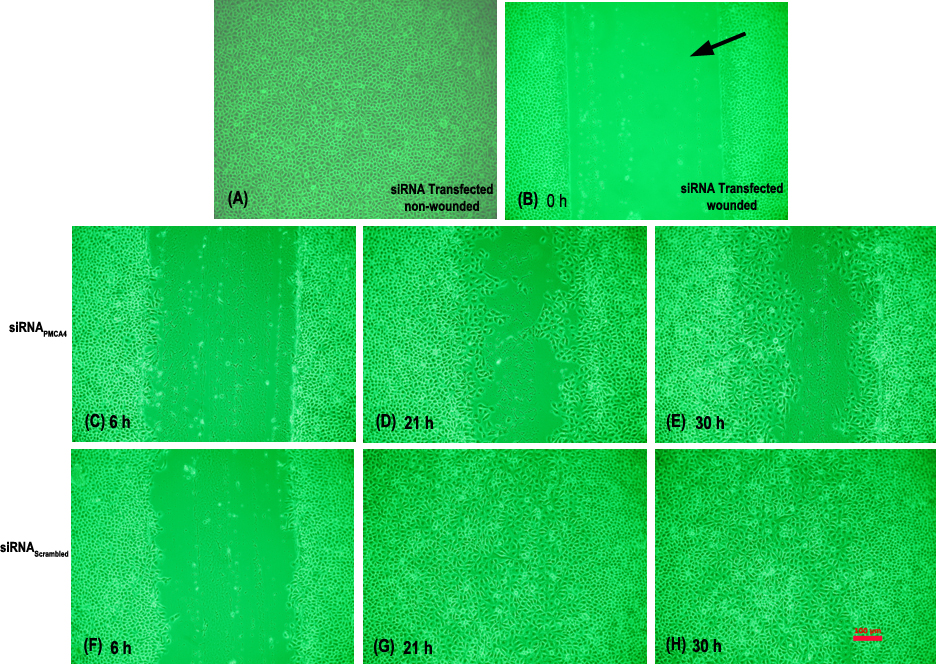
 Figure 7 of
Talarico, Mol Vis 2010; 16:2259-2272.
Figure 7 of
Talarico, Mol Vis 2010; 16:2259-2272.