Figure 3. Quantitative analysis of plasma membrane calcium-ATPase isoform 4 (PMCA4) distribution in basal epithelial cells at the wound
margin during reepithelialization. The percentage of basal epithelial cells that exhibited PMCA4 staining in the apical plasma
membrane, basal plasma membrane and cytoplasm in wounded and control corneas at 6 h (A), 24 h (B), and 36 h (C) is shown. Note in particular, the prominent redistribution of PMCA4 staining from apical to basal cell membranes in the
wounded eye between 6 and 24 h as well as the increase in cytoplasmic staining in wounded versus controls eyes at 6 and 24
h. The asterisk (*) represents a p value less than or equal to 0.01.
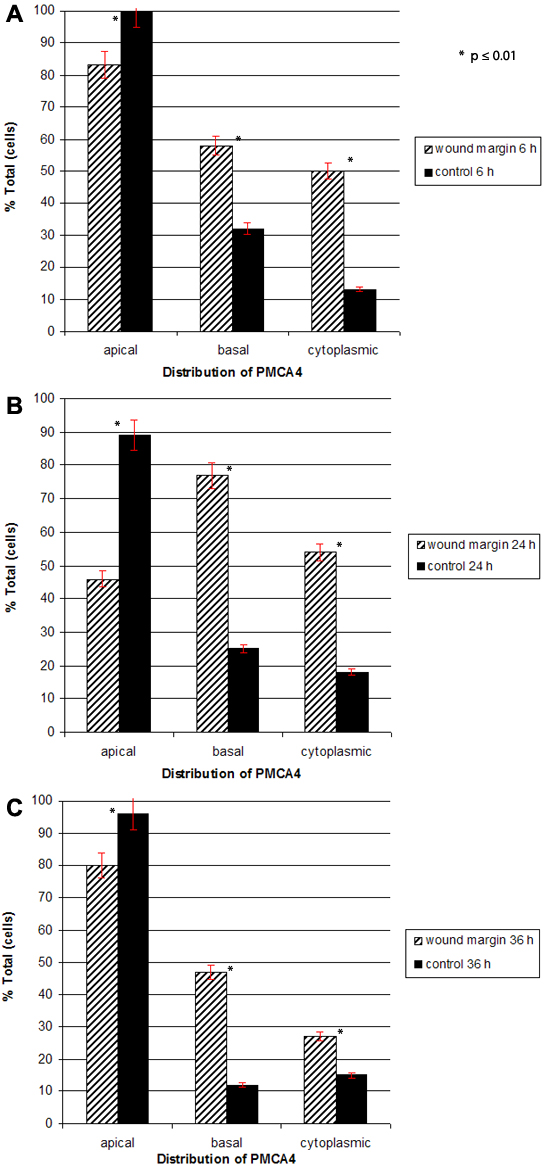
 Figure 3 of
Talarico, Mol Vis 2010; 16:2259-2272.
Figure 3 of
Talarico, Mol Vis 2010; 16:2259-2272.