Figure 1. Sensitivities and specificities
for a variety of risk score cutoffs and area under the receiver
operator characteristic (ROC) curve for prediction of age-related
macular degeneration. The area under the ROC curve was 0.860 (95%
confidence interval [CI]: 0.834–0.885; p<0.001) for cases versus
controls with the covariates CFH, ARMS2, CC2, CFB, C3,
smoking status, and age fitted in the regression model (solid line).
The area under the ROC curve showed a non-significant reduction (dotted
line; p=0.22) to 0.857 (95% CI: 0.831, 0.883; p<0.001) upon removal
of C3. The dashed line
represents a reference area of 0.50.
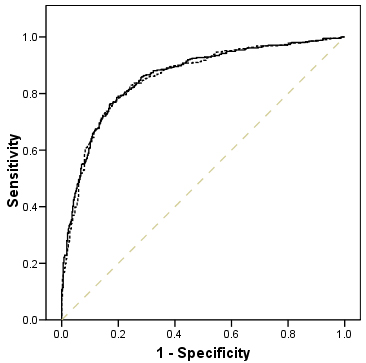
 Figure 1 of McKay, Mol Vis 2010; 16:194-199.