Figure 2. LOXL1 gene expression in
drug-treated (1:1,000 and 1:100) hLEC using real-time PCR. Data were
normalized to β-actin (ACTB). Values represent percent of normal
expression in controls ±SEM of three separate experiments. No
significant decrease in expression was observed in any of the samples.
Significant increases in expression were seen in the Brinzolamide
1:100, Timolol 1:100, and Latanoprost 1:100 groups. * denotes a p-value
<0.003, ** denotes a p-value <0.03, and *** denotes a p-value
<0.05.
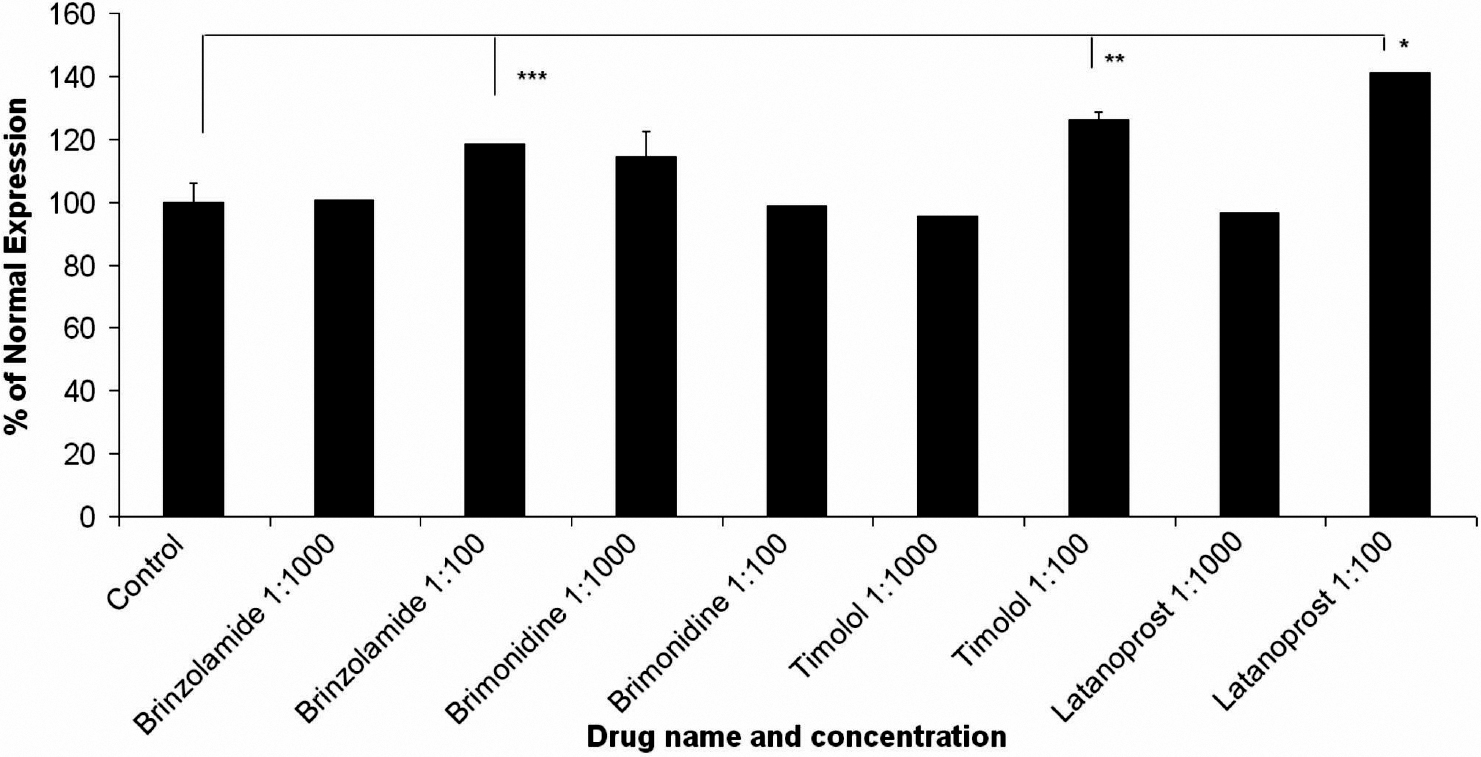
 Figure 2 of Khan, Mol Vis 2010; 16:2236-2241.