Figure 3. Effects of neutrophil depletion on various indexes associated with the pathogenesis of murine CorNV. A and B show the comparison of CorNV in normal and neutrophil-depleted mice at different times after suture placement (n=9 for B). C shows the infiltration under HE staining and D shows costaining of S100A8 or A9 with neutrophil marker Gr-1 at day 7. The examples shown are representative of nine (A, B) or three animals (C, D) in each group; the asterisk indicates a p<0.05 versus control.
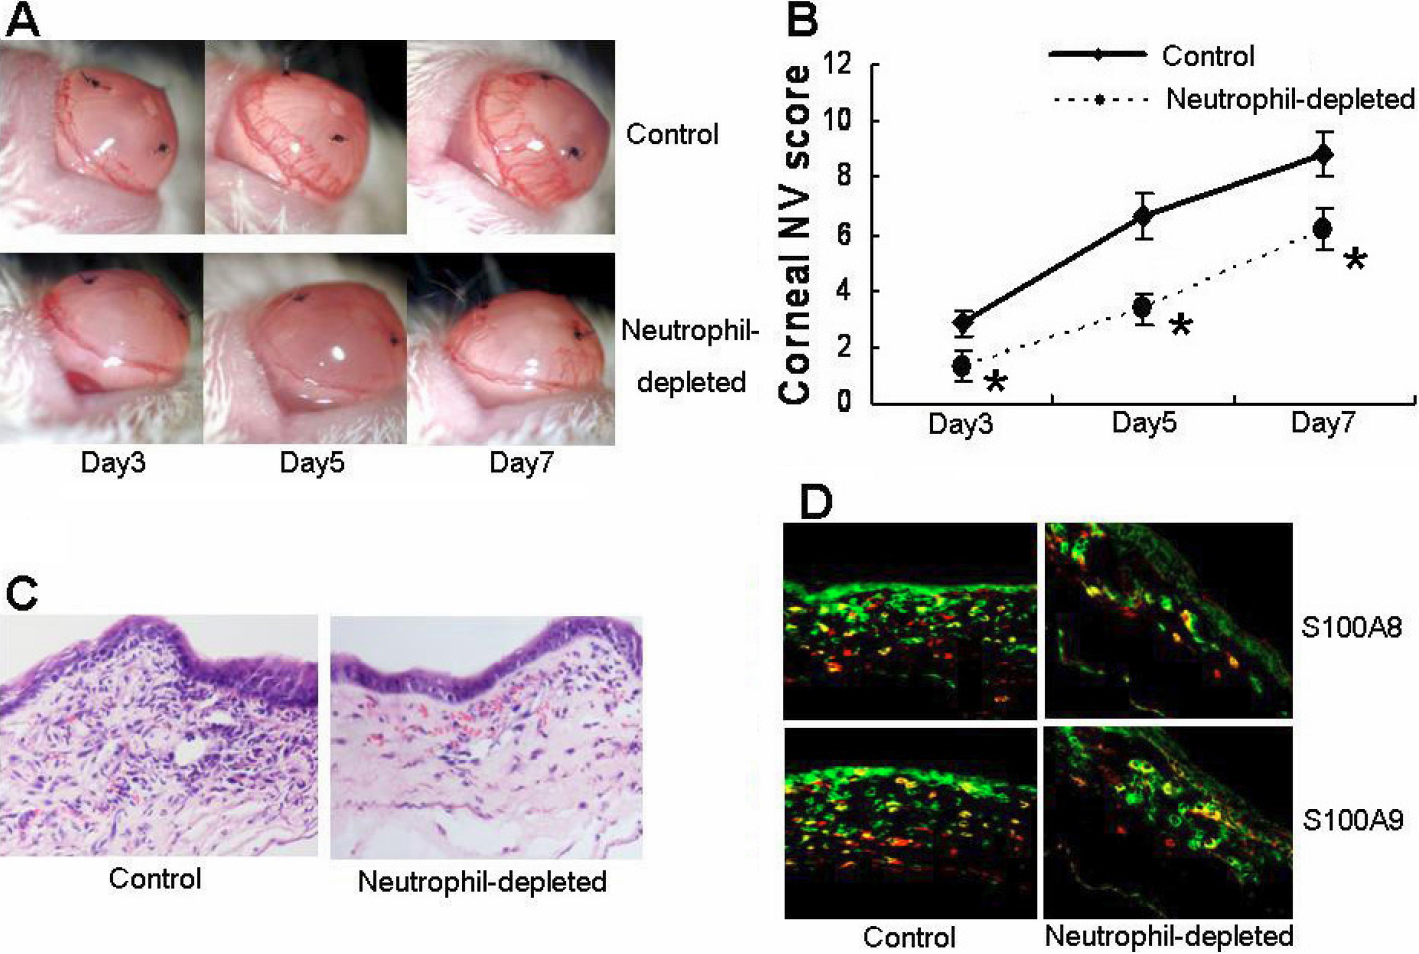
 Figure 3 of
Li, Mol Vis 2010; 16:2225-2235.
Figure 3 of
Li, Mol Vis 2010; 16:2225-2235.