Figure 5. Western blot analysis. GAPDH was used as the loading control. A: The proteins identities are indicated on the right. B: Band intensity was quantified by densitometry and the fold difference of each microfilament regulator in the conjunctival
bulbar and palpebral epithelia compared to the conjunctival forniceal epithelia was expressed graphically. bcj, bulbar conjunctiva;
pcj, palpebral conjunctiva.
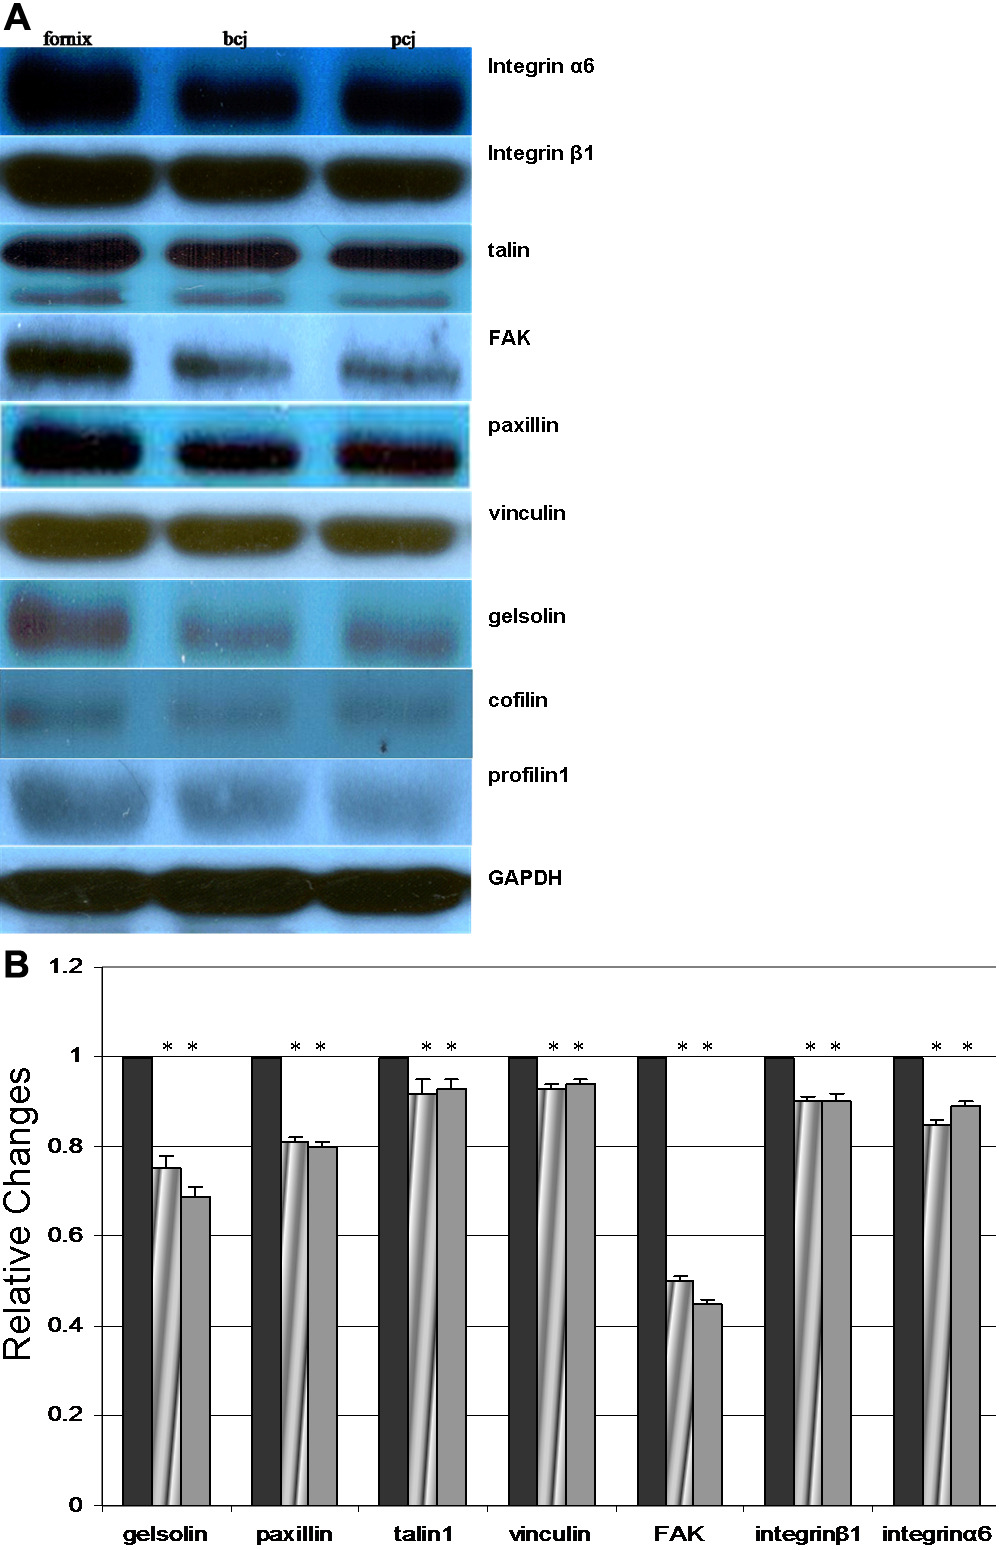
 Figure 5 of
Zhu, Mol Vis 2010; 16:2215-2224.
Figure 5 of
Zhu, Mol Vis 2010; 16:2215-2224.