Figure 4. Relative real-time PCR results. Fold difference of each target gene expression among different samples in comparison with
conjunctival forniceal epithelial cells. The calculation of the fold difference was described in Methods. The asterisk indicates
a significant difference, p<0.05, compared to the transcript level in forniceal epithelial cells. bcj, bulbar conjunctiva;
pcj, palpebral conjunctiva.
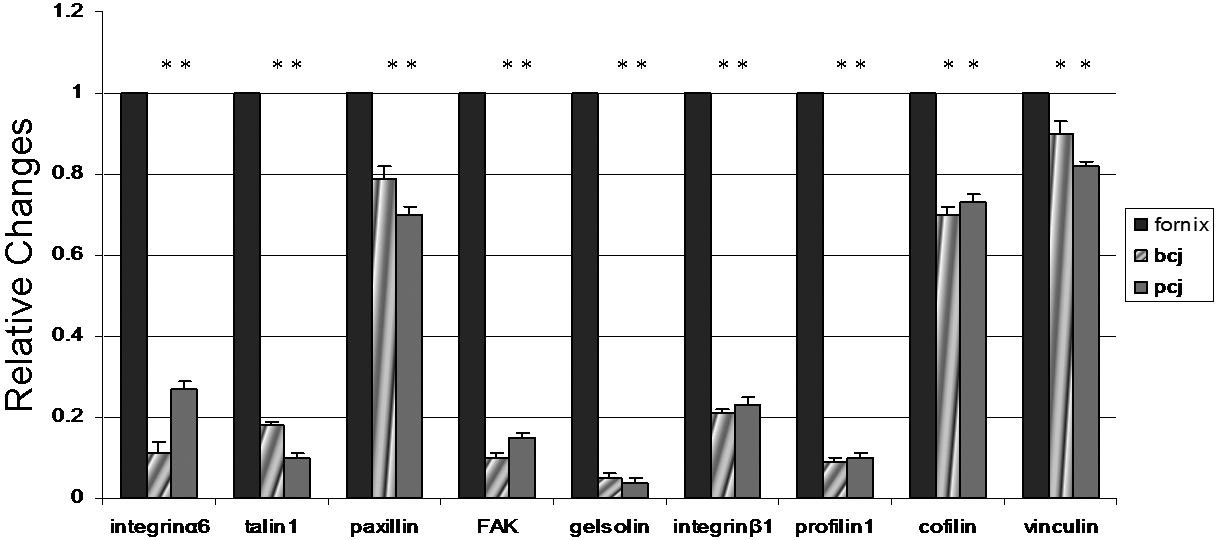
 Figure 4 of
Zhu, Mol Vis 2010; 16:2215-2224.
Figure 4 of
Zhu, Mol Vis 2010; 16:2215-2224.