Figure 3. Trend toward normalization of pathological analyte profile after bevacizumab treatment. This figure shows a comparison of
24 analytes that showed a 1.5 fold or more change in the aqueous of eyes with VEGF-related pathology as compared to normal
values. The effect of treatment on the analyte profile was followed by analyzing the samples from the same patients after
treatment. The figure shows that all analytes upregulated in pre-treatment samples showed a trend toward normalization. Two
groups of analytes (pre-treated versus normal and post-treated versus normal) were compared for each analyte using the Tukey’s
post-hoc comparison test. Stars show significant differences (p<0.05) between pre-treated versus normal.
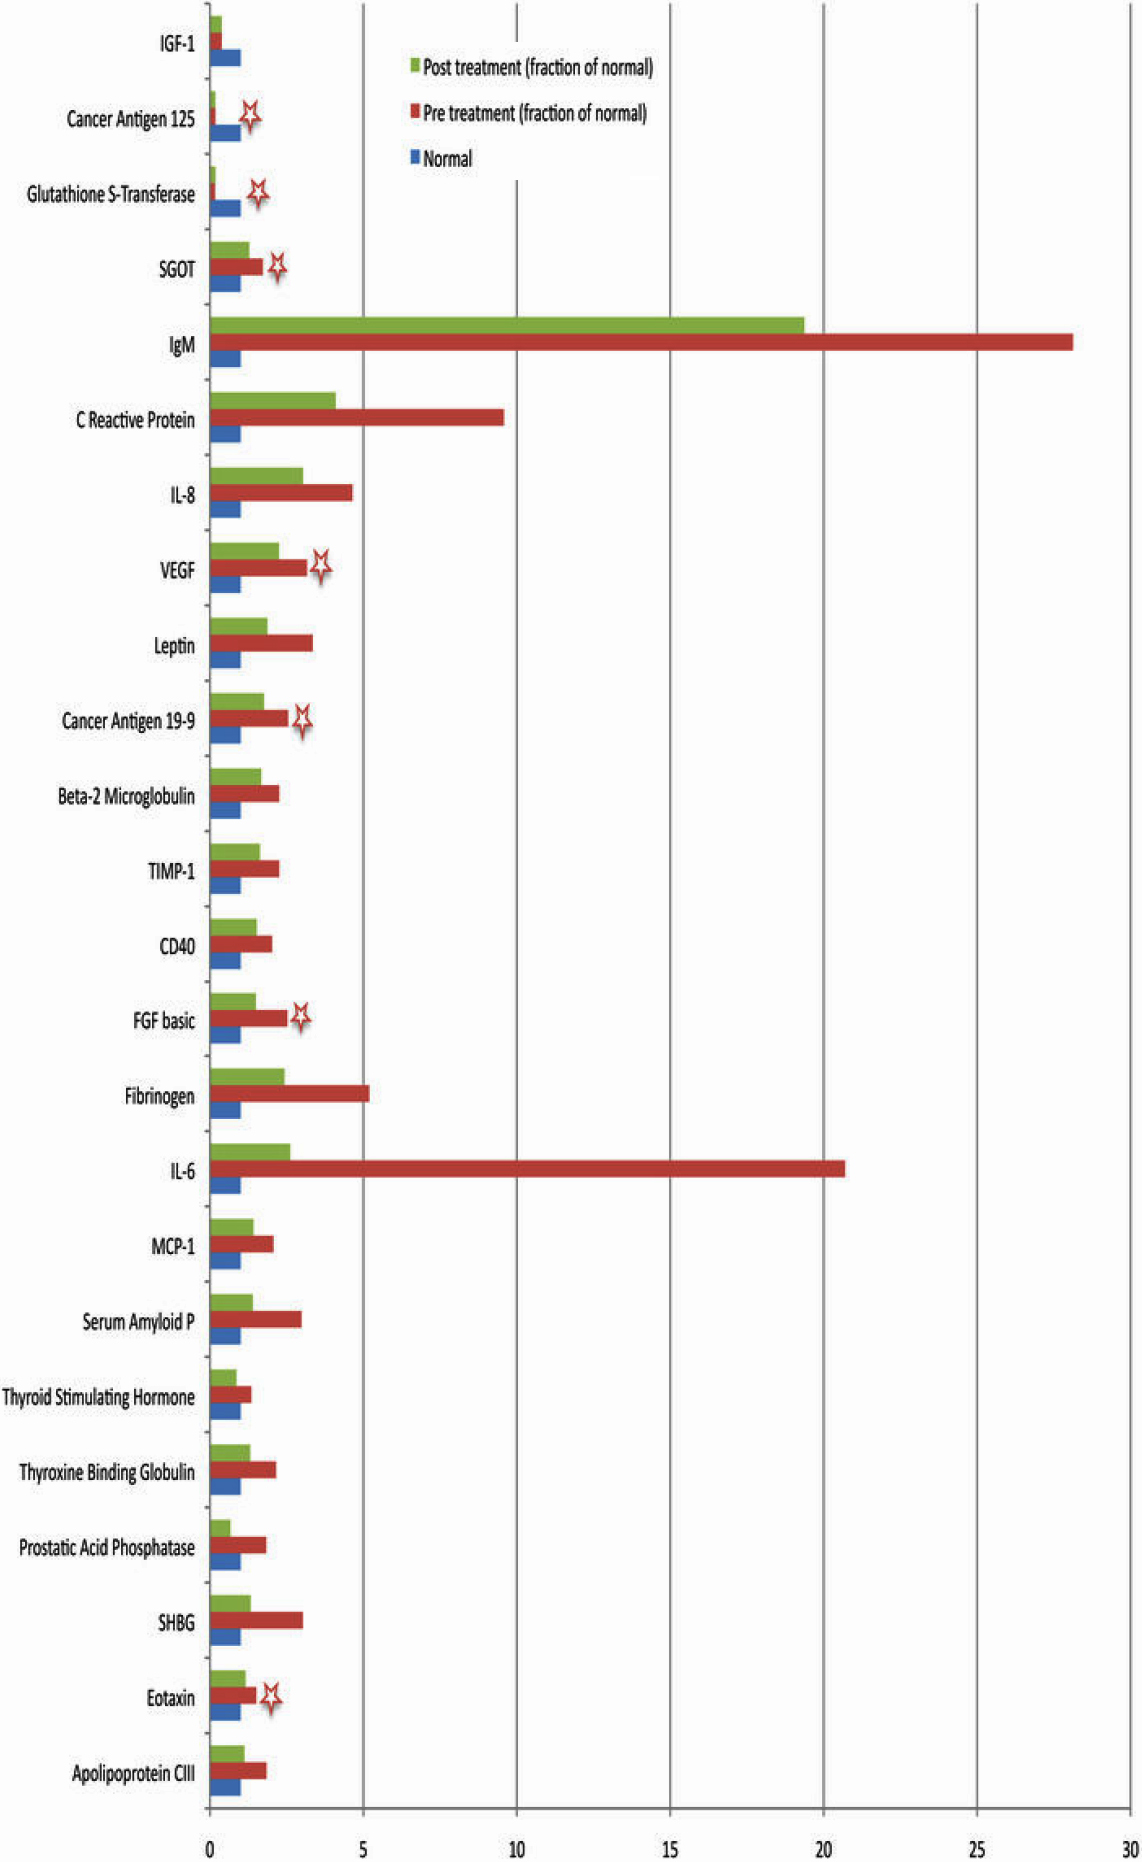
 Figure 3 of
Sharma, Mol Vis 2010; 16:2175-2184.
Figure 3 of
Sharma, Mol Vis 2010; 16:2175-2184.