Figure 2. Changes after treatment compared
to pretreatment values. The figure shows fold change in the analyte
profile in the aqueous humor of patients with VEGF-related pathologies
(pre-treatment samples) as compared to the aqueous profile of treated
patients (post-treatment). Forty-three analytes were common in pre- and
post-treatment samples; out of these, seven analytes were upregulated
and the other 36 were down-regulated, suggesting a trend toward
normalization.
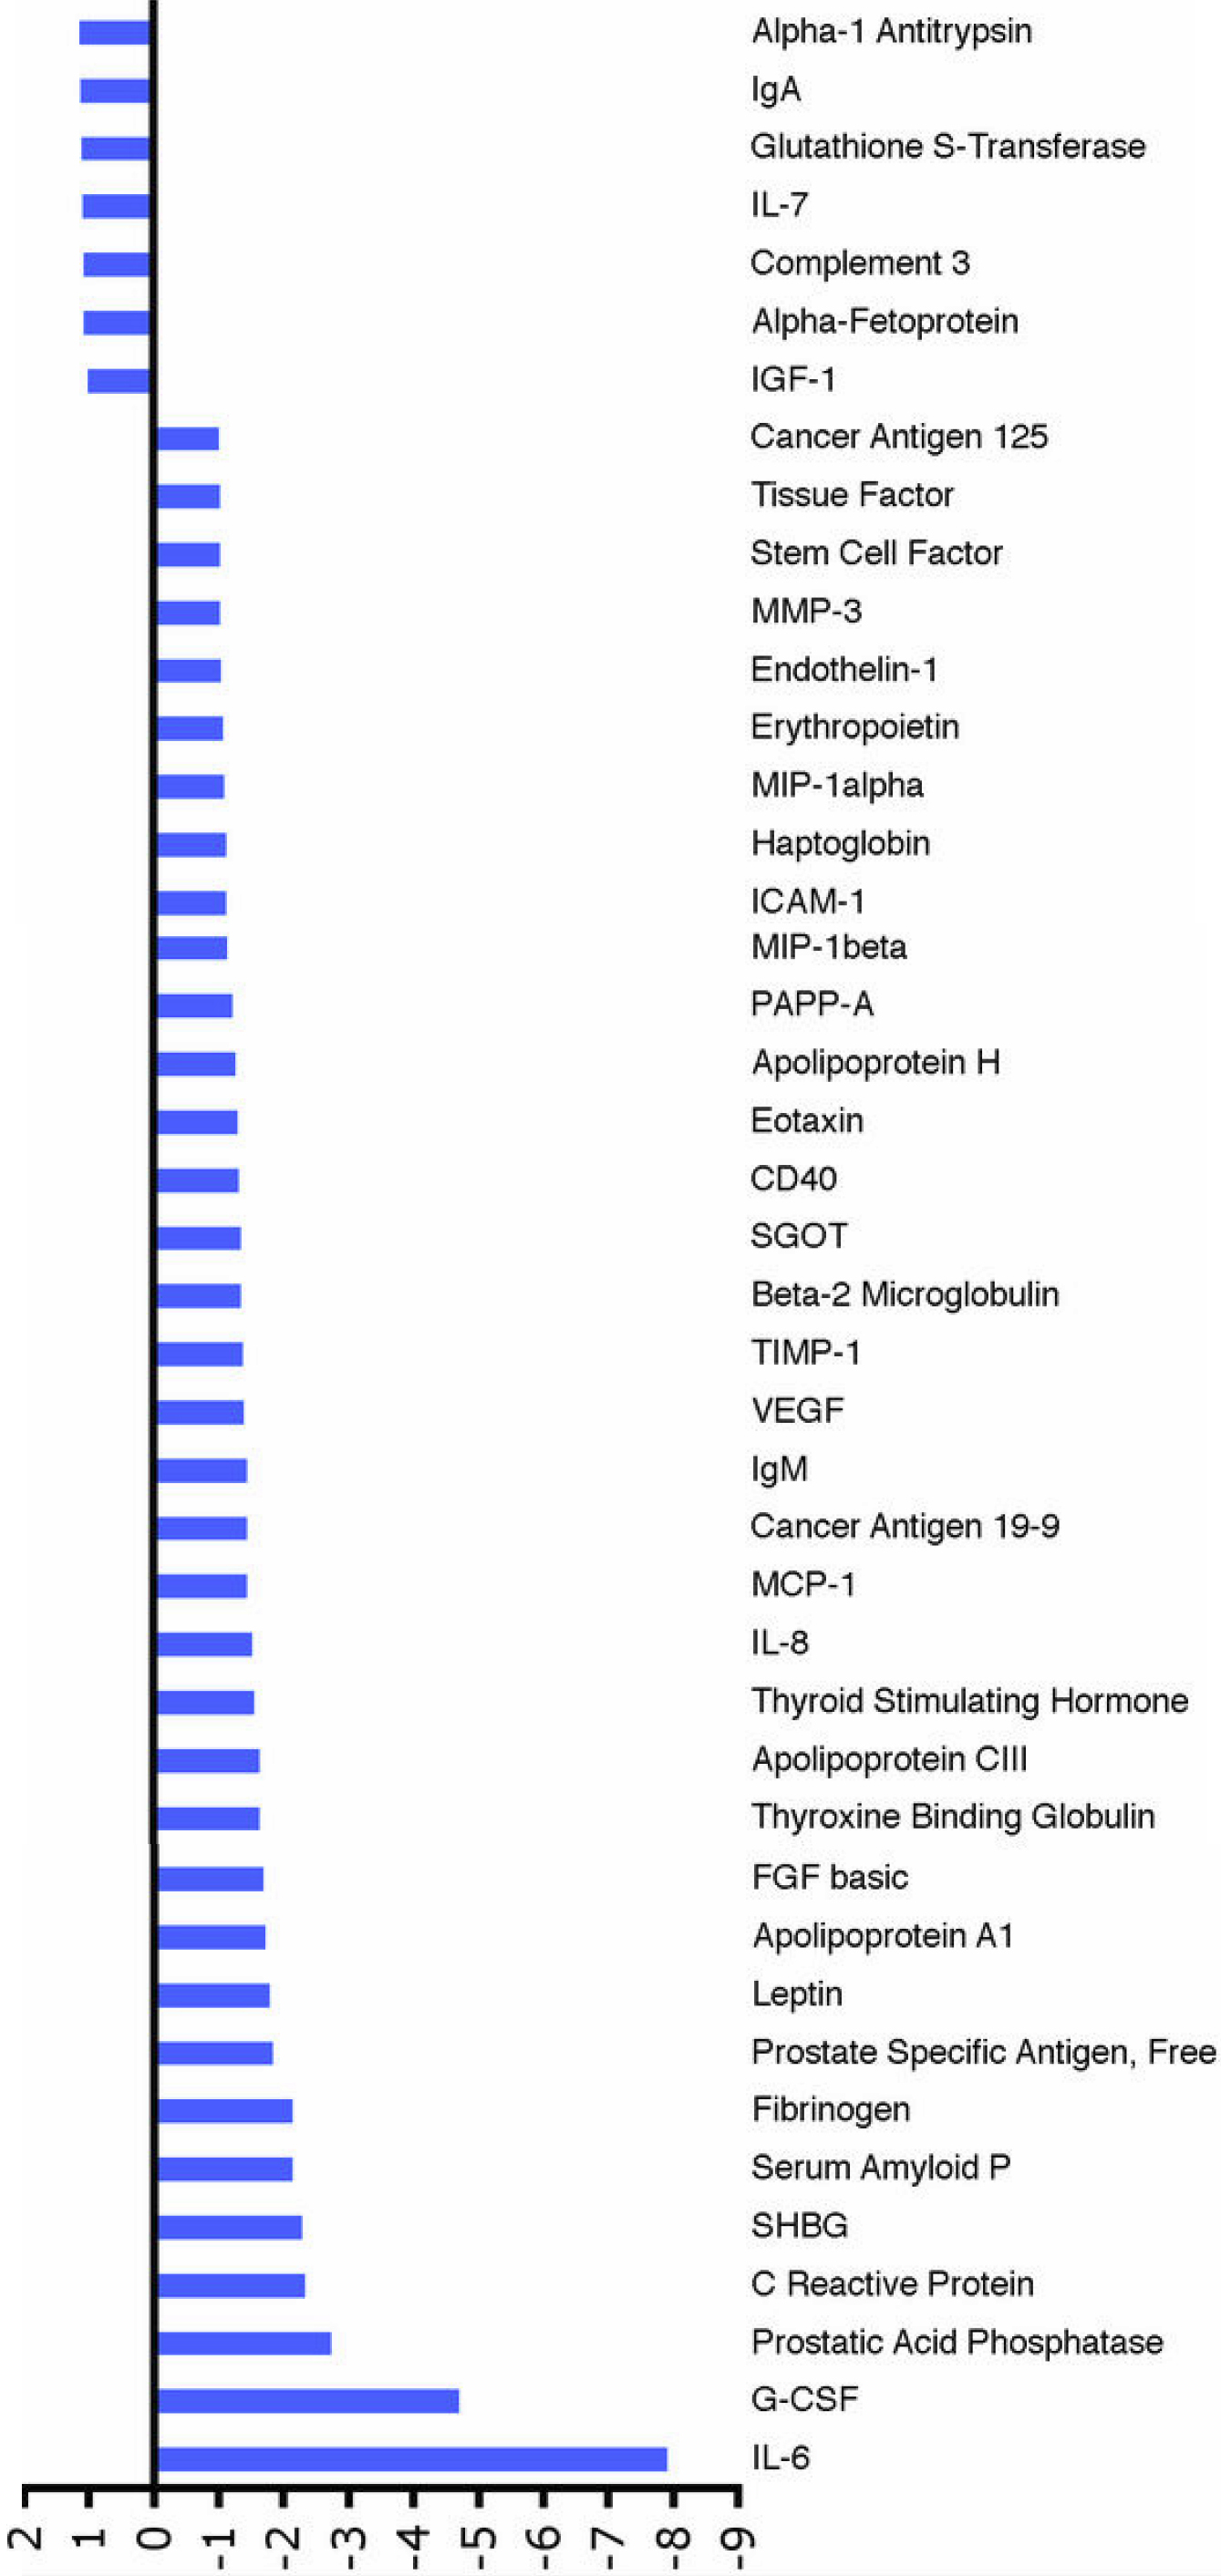
 Figure 2 of Sharma, Mol Vis 2010; 16:2175-2184.